> Source: [sk181994](https://support.checkpoint.com/results/sk/sk181994)
# sk181994 - How to monitor the status of VPN Network Probes in R82 and higher
| Property | Value |
|----------|-------|
| Solution ID | sk181994 |
| Date Created | 2024-02-06 |
| Last Modified | 2025-11-10 |
| Technical Level | General |
| Products | Security Gateway |
| Versions | R82.10, R82 |
| OS | Gaia |
## Solution
**Table of Contents:**
* Overview
* Requirements
* Configuration
* Documentation
Click Here to Show the Entire Article
### Overview {#1}
Starting from the version R82, you can configure a dedicated object of type **Network Probe**, in which you specify a probing destination.
Security Gateways with the configured Site to Site VPN use this Network Probe object to probe the configured destination.
Based on the probing success and failure, you can determine if the VPN peer is reachable.
You can monitor the states of the Network Probes in these ways:
|---------------------------------------------------------|------------------------------------------------------------------------------------------------------------------------------------------------------------------------------------------------------------------------------------------------------------------------------------------------------------------------------------------------------------------------------------------------------------------------------------------------------------------------------------------------------------------------------------------------------------------------------------------------------------------------------------------------------------------------------------------------------------------------------------------------|
| Where to Monitor | How to Monitor |
| In a Grafana dashboard | See the "Configuration" section below. |
| On the Security Gateway, Cluster Member, Security Group | * **Recommended:** Run the CLI command "`vpn tu list probes`" in Gaia Clish / Gaia gClish. For more information, refer to the *CLI Reference Guide* for your version ([R82](https://sc1.checkpoint.com/documents/R82/WebAdminGuides/EN/CP_R82_CLI_ReferenceGuide/Content/Topics-CLIG/VPNSG/vpn-tu-list.htm)). * Run the CLI command "`probemon`" in the Expert mode. Notes: * To see the available output options, run: `probemon help` * This command does not support IPv6. * This command supports a maximum of 500 probes. For more information, refer to the *CLI Reference Guide* for your version ([R82](https://sc1.checkpoint.com/documents/R82/WebAdminGuides/EN/CP_R82_CLI_ReferenceGuide/Content/Topics-CLIG/VPNSG/probemon.htm)). |
Note - In SmartConsole, you can only configure Network Probes (it does not show their states).
### Requirements {#2}
Show / Hide this section
>
> |---|-----------------------------------------|--------------------------------------------------------------------------------------------------------------------------------------------------------------------------------------------------------------------------------------------------------------------------------------------------------------------------------------------------------------------------------------------------------------------------------------------------------------------------------------------------|--------------------------------------------------------------------------|
> | # | Server | Description | Requirement |
> | 1 | Check Point Management Server | * Security Management Server * Multi-Domain Security Management Server | * R82 and higher |
> | 2 | Check Point Security Gateway or Cluster | * Security Gateway * ElasticXL * ClusterXL * Security Group on Maestro / Scalable Chassis * VSNext Virtual Gateway * Legacy VSX Virtual System (on a Legacy VSX Gateway or Legacy VSX Cluster) | 1. R82 and higher 2. Enabled and configured the IPSec VPN Software Blade |
> | 3 | External Server | Runs this software to analyze the collected data: * **Prometheus Server** A third-party software that collects, stores, and queries metrics with a dedicated Timeseries Database. The Prometheus Server exposes a Remote Write endpoint to which data can be pushed and stores the data in its local database. * **Grafana Server** A third-party software that connects to multiple data sources/databases (such as Prometheus) and visualizes the data, builds graphs, dashboards, and alerts. | * Prometheus version 2.37.1 and higher * Grafana version 9 and higher |
### Configuration for the Prometheus Server and the Grafana Server {#3}
Show / Hide this section
1. Install the Prometheus Server.
See the [Skyline Administration Guide](https://sc1.checkpoint.com/documents/Appliances/Skyline/Content/Topics-AG/Configuration-on-Servers-Gaia-OS-Prometheus-with-Grafana.htm) \> section "**Skyline Configuration on Check Point Servers that run Gaia OS - Prometheus with Grafana** " \> follow "**Step 1 - Install the Prometheus Server**".
2. Install the Grafana Server.
See the [Skyline Administration Guide](https://sc1.checkpoint.com/documents/Appliances/Skyline/Content/Topics-AG/Configuration-on-Servers-Gaia-OS-Prometheus-with-Grafana.htm) \> section "**Skyline Configuration on Check Point Servers that run Gaia OS - Prometheus with Grafana** " \> follow "**Step 2 - Install the Grafana Server**".
3. Connect with SmartConsole to the Security Management Server (R82 and higher) / applicable Domain Management Server on the Multi-Domain Security Management Server (R82 and higher).
4. Add and configure the applicable VPN Network Probe objects.
1. Create new applicable Network Probe objects in **one** of these ways:
Show / Hide this section
* In the **Security Policies** view (recommended):
1. From the left navigation panel, click **Security Policies**.
2. In the top middle panel, click **Access Control**.
3. In the bottom middle panel **Access Tools** , click **VPN Network Probes**.
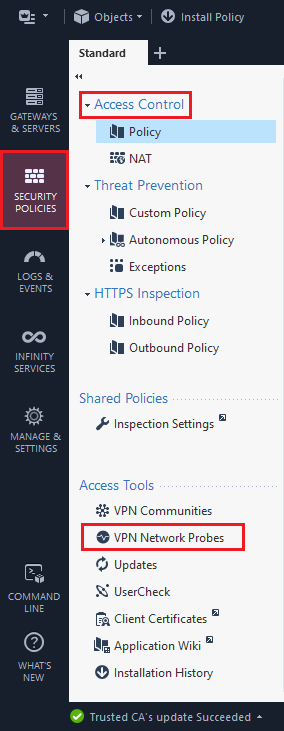
4. From the top toolbar, click  (**New**).
* In the **Objects** panel:
1. In the top right corner of SmartConsole, click the **Objects** panel.
2. Click **New** \> **More** \> **Network Object** \> **Network Probe**.
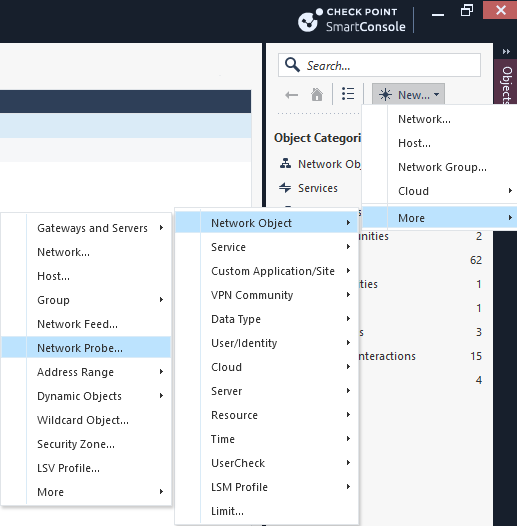
2. Configure the VPN Network Probe object:
Show / Hide this section
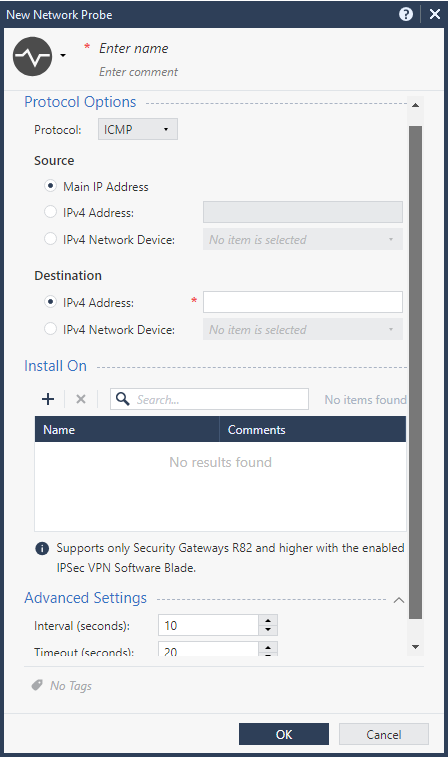
1. Enter the applicable name for this object.
2. In the **Protocol** field, select the applicable probing protocol - **ICMP** or **HTTP**.
* If you selected **ICMP**:
In the **Source** section, configure the source IPv4 address of the probing packets. You can select the Main IPv4 Address of the Security Gateway / Cluster object, manually enter an IPv4 address, or select a Host object that represents the relevant source IPv4 address.
In the **Destination** section, configure the target IPv4 address of the probing packets. You can manually enter an IPv4 address, or select a Host object that represents the relevant target IPv4 address.
**Note:** In R82 and higher, the direct ICMP mode (implicitly determined by the configured ICMP probe source IP address) does not support VPN Route-Based topologies.
* If you selected **HTTP**:
In the **Destination URL** field, enter the target URL.
3. In the **Install On** section, select the applicable Security Gateway / Cluster objects (R82 and higher).
4. In the **Advanced Settings** section, configure the applicable probing settings - interval and timeout.
5. Click **OK**.
Example:
5. Configure the Access Control policy to:
1. Allow the connection from the Security Gateway to the configured probing destinations.
2. Allow the connection from the Security Gateway to the Prometheus Server.
6. Install the Access Control policy on the applicable Security Gateway / Cluster objects.
7. On the Grafana Server:
Show / Hide this section
1. Load the example VPN monitoring dashboards.
1. Go to [sk178566 - Skyline Deployment](https://support.checkpoint.com/results/sk/sk178566#Downloads) \> Section "**Downloads**".
2. Download the package "**Grafana Dashboards for Security Gateways, Management Servers, Log Servers, SmartEvent Servers**".
3. Extract the archive.
4. Load these JSON files:
* **Network Probe Monitor.json**
* **VPN Tunnel Dashboard.json**
2. In the Grafana dashboard "**Network Probe Monitor**", monitor the states of the VPN network probes.
3. In the Grafana dashboard "**VPN Tunnel Dashboard**", monitor the states of the VPN tunnels.
### Documentation {#4}
* [Skyline Administration Guide](https://sc1.checkpoint.com/documents/Appliances/Skyline/Default.htm)
* [Prometheus](https://prometheus.io/docs/introduction/overview/)
* [Grafana](https://grafana.com/docs/grafana/latest/introduction/)
* [R82 Site to Site VPN Administration Guide](https://sc1.checkpoint.com/documents/R82/WebAdminGuides/EN/CP_R82_SitetoSiteVPN_AdminGuide/Default.htm)
* [R82 CLI Reference Guide](https://sc1.checkpoint.com/documents/R82/WebAdminGuides/EN/CP_R82_CLI_ReferenceGuide/Default.htm)
---
# Agent Instructions
This content is from the Check Point Support Center (https://support.checkpoint.com), the official knowledge base for Check Point cybersecurity products.
## Navigating This Knowledge Base
- **Complete index**: [llms.txt](https://support.checkpoint.com/llms.txt)
- **All SK articles**: [SecureKnowledge Sitemap](https://support.checkpoint.com/sitemaps/secureknowledge-sitemap-index.xml)
- **SK article URL pattern**: `https://support.checkpoint.com/results/sk/{skId}`
- **Markdown responses**: AI bot User-Agents automatically receive `text/markdown` content