> Source: [sk179870](https://support.checkpoint.com/results/sk/sk179870)
# sk179870 - Skyline Troubleshooting and FAQ
| Property | Value |
|----------|-------|
| Solution ID | sk179870 |
| Date Created | 2022-09-20 |
| Last Modified | 2026-05-05 |
| Technical Level | General |
| Products | Security Gateway, Security Management Server, Scalable Platforms, Multi-Domain Security Management Server |
| Versions | R82, R81.20, R81.10 (EOS), R82, R81.20, R81 (EOS), R82, R81.20, R81.10 (EOS), R81 (EOS), R81.10 (EOS), R81 (EOS), R81 (EOS), R81.10 (EOS), R81.20, R82 |
| OS | Gaia |
## Solution
### Introduction
This is a troubleshooting and FAQ guide for the Skyline solution, which quickly and efficiently monitors your Check Point servers. For more details about Skyline, see [sk178566 - Skyline Deployment](https://support.checkpoint.com/results/sk/sk178566).
Show the Entire Article
### FAQ
* How do I set Prometheus to save data for more than 15 days?
> Add this argument when you run the Prometheus executable:
>
> `--storage.tsdb.retention.time={y|m|d}`
> > Example for 1 year:
> >
> > `--storage.tsdb.retention.time=1y`
> >
> > Example for 2 months:
> >
> > `--storage.tsdb.retention.time=2m`
> >
> > Example for 3 days:
> >
> > `--storage.tsdb.retention.time=3d`
* How do I group my machines (for example, under the same cluster name)? What does "environment" mean?
> An "environment" allows you to group machines under a common name. For example, you can set the environment "Cluster1" to "GW-A" and "GW-B", and they appear under the environment "Cluster1" in the dashboard.
>
> To set the environment:
> 1. Connect to the command line.
>
> 2. Log in to the Expert mode.
>
> 3. Run:
>
> `sklnctl export --set-env `
* Can I set a custom name for my devices / environments?
> The hostname of the machine automatically sets the name on Skyline. To change the name, set the reporting machine's name to the desired hostname. See the above instructions on how to set the environment.
* How do I set TLS on Grafana?
> When you set the data source:
> 1. Select the CA certificate radio button and the **Basic Authentication** radio button.
>
> 2. Enter the CA certificate.
>
> 3. Enter the username and password.
* How do I install a Prometheus server or a Grafana Server?
> The Prometheus and Grafana Servers are third-party and Open Source. Accordingly, you can install them on most Linux distributions and on Windows.
>
> Refer to the guides below or other applicable guides:
>
> **Ubuntu 20.04**:
> * [Prometheus](https://linuxopsys.com/topics/install-prometheus-on-ubuntu)
> * [Grafana](https://linuxhostsupport.com/blog/how-to-install-grafana-on-ubuntu-20-04/)
>
> **Red Hat 7 / CentOS 7**:
> * [Prometheus](https://computingforgeeks.com/install-prometheus-server-on-centos-rhel/)
> * [Grafana](https://grafana.com/docs/grafana/latest/setup-grafana/installation/rpm/)
>
> **Windows**:
> * [Prometheus](https://www.coretechnologies.com/products/AlwaysUp/Apps/InstallPrometheusAsAWindowsService.html)
> * [Grafana](https://devconnected.com/how-to-install-grafana-on-windows-8-10/)
>
> **Important Note** : Make sure to activate the remote-write flag ([click here for instructions](https://prometheus.io/docs/prometheus/latest/feature_flags/)) and to enable basic authentication and TLS.
* How do I monitor the throughput of the OpenTelemetry Collector and Skyline?
> 1. Start from a machine reporting to Skyline.
>
> 2. Run this command to create a TCPDdump PCAP file on the Security Gateway (in the Expert mode):
>
> `(tcpdump -i $(clish -c "show management interface") host and port 9090 -w /var/log/skyline.pcap)`
> 3. Run it for 10-20 minutes.
>
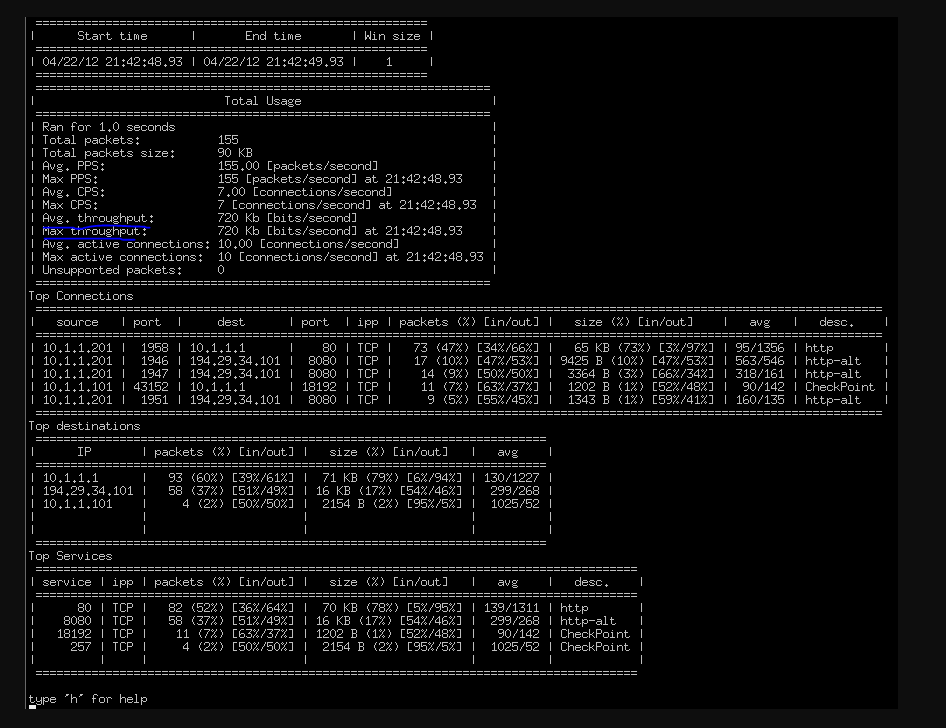
> 4. Use CPMonitor to get the average throughput from the output file (*/var/log/skyline.pcap*).
>
> Example:
>
> 
> 5. Multiply these results by the number of machines reporting to Skyline to get the average and the maximum.
* What are the relevant Check Point Skyline log files?
> * OpenTelemetry Collector:
>
> `/opt/CPotelcol/otelcol.log`
> * CPView Exporter:
>
> `/opt/CPviewExporter/otlp_cpview.log`
> * CPView API Service:
>
> `$CPDIR/log/cpview_api_service.elg`
* How to see the current version of the Skyline components?
> On a Scalable Platform Security Group, add the "`g_allc`" comand in front of each command below .
> * OpenTelemetry Collector:
>
> `/opt/CPotelcol/otelcol --version`
> * CPView Exporter:
>
> `/opt/CPviewExporter/otlp_cpview --version`
> * CPView API Service:
>
> `cat $CPDIR/conf/cpview_api_service.version`
* How to restart the Skyline components?
> On a Scalable Platform Security Group, add the "`g_all`" comand in front of each command below.
> * OpenTelemetry Collector:
>
> 1. `/opt/CPotelcol/stop`
>
> 2. `/opt/CPotelcol/start`
>
> * CPView Exporter:
>
> 1. `/opt/CPviewExporter/stop`
>
> 2. `/opt/CPviewExporter/start`
>
> * CPView API Service:
>
> 1. `cpview -a off`
>
> 2. `cpview -a on`
* How to configure the interval for extracting data from CPView?
> The configuration depends on the CPViewExporter Take (see [sk180521](https://support.checkpoint.com/results/sk/sk180521)).
> * **CPViewExporter Take 34 and lower:**
>
> **Note** - for Take 35 and above, the command is `/opt/CPviewExporter/CPviewExporterCli.sh cpview_exporter refresh_rate ((s|h|m)|delete) && /opt/CPviewExporter/CPviewExporterCli.sh reconfigure`
> 1. Connect to the command line on the Security Gateway / Management Server.
>
> 2. Log in to the Expert mode.
>
> 3. Create the `/opt/CPviewExporter/config.yaml` file:
>
> `touch /opt/CPviewExporter/config.yaml`
> 4. Edit the `/opt/CPviewExporter/config.yaml` file:
>
> `vi /opt/CPviewExporter/config.yaml`
> 5. Add these lines:
>
> ```
> service:
> interval:
> ```
>
> 6. Save the changes in the file and exit Vi editor.
>
> 7. Stop the CPviewExporter:
>
> `/opt/CPviewExporter/stop`
> 8. Start the CPviewExporter:
>
> `/opt/CPviewExporter/start`
* Why does Skyline use TCP port 0?
> Skyline uses TCP port 0 for internal OpenTelemetry (OTLP) health check services.
> Port 0 behavior (Linux):
> * Port 0 is a reserved value and is not used for regular traffic.
> * When a process binds to port 0, the operating system automatically assigns an available ephemeral port.
> * Port 0 cannot be accessed directly and connection attempts to it typically fail.
>
> Implication for Skyline:
>
>
> * This mechanism is used to hide internal health check services.
> * These services are not externally exposed and are not intended for user access or troubleshooting via direct connection.
>
> Loopback context:
>
>
> * These internal services may run on the loopback interface (127.0.0.1).
> * Loopback traffic remains local to the Gateway and is not visible externally.
### Common Issues
* The Grafana dashboard shows duplicate data.
> This issue occurs when you change certain data (for example, the policy name after a policy installation). After five minutes, the duplication should disappear.
* There is no data on the Grafana Dashboard.
> Use the [Prometheus graph tool](https://prometheus.io/docs/visualization/browser/) to see the metrics received from the machine. Usually, the tool sits on port 9090, by default, or on the port configured for Prometheus.
>
> Click on **Graph** to see all the records over time. A common example of a testing metric is "*hardwaremodel*".
>
> If the data exists, then make sure you configured the Grafana correctly. [Refer to the documentation here](https://prometheus.io/docs/visualization/grafana/).
>
> If the data is not there, examine the OpenTelemetry Collector logs:
> * Ignore lines with the "`Error:`" prefix that have a date before the current run.
> * If there is a syntax error or a severe issue, the log should start with the prefix "`Error:`".
>
> If you do not see a log with the "`Error:`" prefix, examine the CPView exporter logs.
> * Similarly to the Open Telemetry collector, you are not required to make any changes in the `/opt/CPviewExporter/config.yml` file.
> * Make sure to revert the changes and set is as supplied with the Jumbo Hotfix Accumulator. If there is a severe error, the line starts with the prefix "`Error:`"
>
> If there is no issue on the CPView exporter or the OpenTelemetry collector, run this command:
>
> `cpview -m`
>
> If there is no response or an invalid response (usually, an empty response), then contact [Check Point Support](https://www.checkpoint.com/support-services/contact-support/).
>
> You can use the "`cpwd_admin list`" command to monitor the CPviewExporter (to see if it is running - the "`STAT`" column must show "`E`"):
>
> **Example output**:
>
> ```
> [Expert@HostName:0]# cpwd_admin list
> APP PID STAT #START START_TIME MON COMMAND
> FWK_FORKER 9996 E 1 [18:23:37] 27/10/2022 N fwk_forker
> FWK_WD 10005 E 1 [18:23:37] 27/10/2022 N fwk_wd -i 14 -i6 0
> CPVIEWD 10263 E 1 [18:23:49] 27/10/2022 N cpviewd
> CPVIEWS 10268 E 1 [18:23:49] 27/10/2022 N cpview_services
> CVIEWAPIS 18917 E 1 [10:33:13] 28/10/2022 N cpview_api_service
> SXL_STATD 10279 E 1 [18:23:50] 27/10/2022 N sxl_statd
> CPD 10291 E 1 [18:23:51] 27/10/2022 Y cpd
> MPDAEMON 10319 E 1 [18:23:51] 27/10/2022 N mpdaemon /opt/CPshrd-R81.10/log/mpdaemon.elg /opt/CPshrd-R81.10/conf/mpdaemon.conf
> TP_CONF_SERVICE 6083 E 1 [18:27:02] 27/10/2022 N tp_conf_service --conf=tp_conf.json --log=error
> CI_CLEANUP 10424 E 1 [18:23:54] 27/10/2022 N avi_del_tmp_files
> CIHS 10431 E 1 [18:23:54] 27/10/2022 N ci_http_server -j -f /opt/CPsuite-R81.10/fw1/conf/cihs.conf
> FWD 10456 E 1 [18:23:54] 27/10/2022 N fwd
> SPIKE_DETECTIVE 10461 E 1 [18:23:54] 27/10/2022 N spike_detective
> MDPSD 10463 E 1 [18:23:54] 27/10/2022 N mdpsd
> LPD 10966 E 1 [18:24:00] 27/10/2022 N lpd
> DASERVICE 14903 E 1 [18:24:17] 27/10/2022 N DAService_script
> AUTOUPDATER 14916 E 1 [18:24:17] 27/10/2022 N AutoUpdaterService.sh
> OTLPAGENT 31399 E 1 [19:19:05] 27/10/2022 N cpview_exporter
> ```
* There are "*Out of bounds*" errors in the OpenTelemetry collector log.
> The clocks on the reporting and server machines must be synchronized and correct.
>
> To solve the issue:
> 1. Set the correct time in the clock on the Prometheus server and on the Security Gateway.
>
> 2. Reset the Database on the Prometheus server.
>
> 3. Stop and start the Operational Technology (OT) components on the Security Gateway.
>
> 4. Stop and start the Prometheus server.
>
> 5. When Maestro Hyperscale Orchestrators (MHOs) / SMO Security Group Member report "out of order", run Prometheus with these flags:
>
> `--storage.tsdb.min-block-duration=24h --storage.tsdb.max-block-duration=24h`
* Skyline does not work in Management Data Plane Separation (MDPS).
> Skyline redirects the traffic automatically to the Management interface of MDPS ([sk138672](https://support.checkpoint.com/results/sk/sk138672)).
>
> To make sure traffic passes to the external IP address, run this command in Gaia Clish:
>
> `add mdps task address `
>
> If there are issues in configuring Skyline with the Gaia REST API or with the */opt/CPotelcol/REST.py* script, then skip the REST API and make sure that you are running the */opt/CPotelcol/REST.py* script from the data plane.
* "*Suspected command injection - Please review your input*" error while running the configuration script
> Make sure that your password for basic authentication contains these characters **only**: A-Z, a-z and 0-9.
>
> In later versions of Skyline updated by the Self Updatable Tool (Otelcol version is higher than 27), you can bypass the issue by adding "`BYPASS_CMD_INJECTION_CHECK=1`" before you run the configuration script on shell.
* Labels appear as a JSON object in the dashboard.
> If you see this or its equivalent on your dashboard:
>
> 
>
> Download the dashboard again. There was an issue with the dashboard in Grafana version 10 that has been fixed.
* The Grafana Dashboard is missing some hostnames.
> This issue might occur when the clocks on the Prometheus Server and the Security Gateway are not synchronized. The Prometheus UI shows this banner:
>
> `Warning: Error fetching server time: 408.92199993133545 seconds time difference between your browser and the server. Prometheus relies on accurate time and time drift might cause unexpected query results.`
>
> Screenshot:
>
> 
>
> Sync the clocks and time zones on the Prometheus Server and the Security Gateway.
* "*Error: 'utf-8' codec can't decode byte*" error when deploying Skyline with the 'REST.py' or 'sklnctl' commands fails in a Maestro Security Group.
> **Symptom:**
> > "`Error: 'utf-8' codec can't decode byte 0xca in position 1: invalid continuation byte`" appears when running one of these commands in a Maestro Security Group:
> > * `/opt/CPotelcol/REST.py --set_open_telemetry "$(payload.json)"`
> >
> > * `sklnctl export --set "$(payload.json)"`
>
> **Solution:**
> 1. Reset the Skyline configuration in the Maestro Security Group:
>
> `gexec -b all -c '/opt/CPotelcol/CPotelcolCli.sh set_dynamic_config "$(cat /opt/CPotelcol/config.json)"'`
> 2. Run the deployment command again.
* On a Scalable Platform, some Security Group Members do not report their metrics
> Note - For the latest 'CPotelcol' package, see [sk180522](https://support.checkpoint.com/results/sk/sk180522).
> 1. Connect to the command line on the Security Group.
>
> 2. Log in to the Expert mode.
>
> 3. Get the information about the install 'CPotelcol' package:
>
> `g_allc cpinfo -y all | grep BUNDLE_CPOTELCOL_AUTOUPDATE`
>
> **Important** - The same Take of the 'CPotelcol' component must be installed on all Security Group Members.
> 4. Get the information about the 'CPotelcol' component settings in the Gaia database:
>
> `g_allc dbget -arv otlp`
>
> **Important** - The same parameters and values must be configured in the Gaia database on all Security Group Members.
> 5. If there is a mismatch between Security Group Members, then:
>
> 1. Reboot the Security Group Members that show different configuration:
>
> `reboot -b `
> 2. Examine the configuration again:
>
> `g_allc cpinfo -y all | grep BUNDLE_CPOTELCOL_AUTOUPDATE`
>
> `g_allc dbget -arv otlp`
> 3. If the issue persists, [contact Check Point Support](https://www.checkpoint.com/support-services/contact-support/).
* CPotelcol memory consumption is high (above 15-20 %).
> This can occur because of how the OpenTelemetry collector batches the metrics and handles traffic going outside on the different pipelines. A blockage can occur, specifically on systems with many data sources or metrics (for example, a VSX with more than five VSs). To avoid this issue, set some configuration optimizations and a memory limiter.
>
> Run these commands:
> 1. `chmod +x cpot_optimizer.py`
> 2. `dos2unix cpot_optimizer.py`
> 3. `cpot_optimizer.py`
>
> Click [here](https://sc1.checkpoint.com/documents/Appliances/Skyline/Content/Topics-Metrics/Skyline-Metrics-Repository.htm) for more information about the different parameters and then change them according to your requirements on the script itself. Alternatively, use our [default optimizations](https://support.checkpoint.com/results/download/136163).
>
> You can also run these commands to set a lighter mode of collection :
> 1. `/opt/CPviewExporter/CPviewExporterCli.sh cpview_exporter dynamic_interval on`
> 2. `/opt/CPviewExporter/CPviewExporterCli.sh stop`
> 3. `/opt/CPviewExporter/CPviewExporterCli.sh start`
* The CPotelcol (OpenTelemetry Collector) package is not updated automatically to the latest build.
> Note - For the latest 'CPotelcol' package, see [sk180522](https://support.checkpoint.com/results/sk/sk180522).
>
> **Symptom:**
> > The CPotelcol (OpenTelemetry Collector) package is not updated automatically to the latest build.
>
> **Cause:**
> > This can happen due to a failure during a previous installation of the CPotelcol package or a previous failed configuration attempt.
>
> **Solution for Security Gateways and Management Servers:**
> 1. Download [this script](https://support.checkpoint.com/results/download/133598) to your computer.
>
> 2. Copy the downloaded script from your computer to the Security Gateway / Management Server to some directory (for example, `/var/log/`).
>
> 3. Connect to the command line on the Security Gateway / Management Server.
>
> 4. Log in to the Expert mode.
>
> 5. Go to the directory with this script:
>
> `cd /var/log/`
> 6. Assign the 'execute' permission to this script:
>
> `chmod -v u+x skyline_hard_reset.sh`
> 7. See the script built-in help:
>
> `./skyline_hard_reset.sh -h`
> 8. Run the script with applicable parameters:
>
> `./skyline_hard_reset.sh `
>
> **Solution for Scalable Platforms:**
> > The required fix is planned for the next Skyline release.
* "*Error: ServerAuth: Bad certificate/API keys* " when running "*sklnctl export --set "$(cat payload-tls.json)*".
> **Symptom:**
> > "`Error: ServerAuth: Bad certificate/API keys`" when running the command "`sklnctl export --set "$(cat payload-tls.json)"`".
> >
> > The issue started after updating the OpenTelemetry Collector (CPotelcol, see [sk180522](https://support.checkpoint.com/results/sk/sk180522)) to Take 125 or higher.
>
> **Cause:**
> > In the JSON payload file, the value string of the key "`ca-public-key`" contains spaces.
> >
> > OpenTelemetry Collector (CPotelcol, see [sk180522](https://support.checkpoint.com/results/sk/sk180522)) Take 97 and lower did not validate the CA format, which must not contain spaces.
>
> **Solution:**
> > Edit the JSON payload file.
> >
> > Make sure the value string of the key "`ca-public-key`" does **not** contain spaces.
> >
> > Example:
> >
> > ```
> > {
> > "enabled": true,
> > "export-targets": {"add": [
> > {
> > "client-auth": {
> > "basic": {
> > "username": "XXXXXX",
> > "password": "XXXXXX"
> > }
> > },
> > "enabled": true,
> > "server-auth": {
> > "ca-public-key": {
> > "type": "PEM-X509",
> > "value": "THIS STRING MUST NOT CONTAIN SPACES"
> > }
> > },
> > "type": "prometheus-remote-write",
> > "url": "https://XXXXXX/api/v1/write"
> > }
> > ]}
> > }
> > ```
---
# Agent Instructions
This content is from the Check Point Support Center (https://support.checkpoint.com), the official knowledge base for Check Point cybersecurity products.
## Navigating This Knowledge Base
- **Complete index**: [llms.txt](https://support.checkpoint.com/llms.txt)
- **All SK articles**: [SecureKnowledge Sitemap](https://support.checkpoint.com/sitemaps/secureknowledge-sitemap-index.xml)
- **SK article URL pattern**: `https://support.checkpoint.com/results/sk/{skId}`
- **Markdown responses**: AI bot User-Agents automatically receive `text/markdown` content