> Source: [sk125092](https://support.checkpoint.com/results/sk/sk125092)
# sk125092 - The DiagnosticsView application for CPInfo output and CPView DB analysis
| Property | Value |
|----------|-------|
| Solution ID | sk125092 |
| Date Created | 2018-04-24 |
| Last Modified | 2025-11-26 |
| Technical Level | General |
| Products | Other |
| Versions | Not Version-Specific |
| OS | Windows |
## Solution
**Table of Contents:**
1. Download Package
2. Overview
3. CPInfo File Open
4. CPInfo Sections Navigation
1. Section Search / In-Section Search
2. Section Filtering
3. Default Sections Data Viewer
5. Layout
6. Policy View
1. R80 and above
* Pool Manager
* Export VM from Pool Manager
2. R77.30 and lower
7. Text Viewer
8. Table Viewer
9. General Information
10. SQLite Viewer
11. CPView DB Viewer
12. Auto-Update
13. About
14. Known Limitations
15. Troubleshooting
16. Release Notes
**Note:** Click the screenshots in this article to increase their size.
(1) Download Package {#01}
==========================
**To download DiagnosticsView, click [here](https://support.checkpoint.com/results/download/61576).**
(2) Overview {#02}
==================
DiagnosticsView is a Windows desktop tool for Check Point Support Engineers.**It replaces the InfoView application**.
DiagnosticsView offers a graphical representation of collected data from [CPInfo](https://support.checkpoint.com/results/sk/sk92739).
After completing the DiagnosticsView package installation, launch DiagnosticsView:
* Start -\> DiagnosticsView
* Double-click the `*.info` or the `*.cpinfo` file
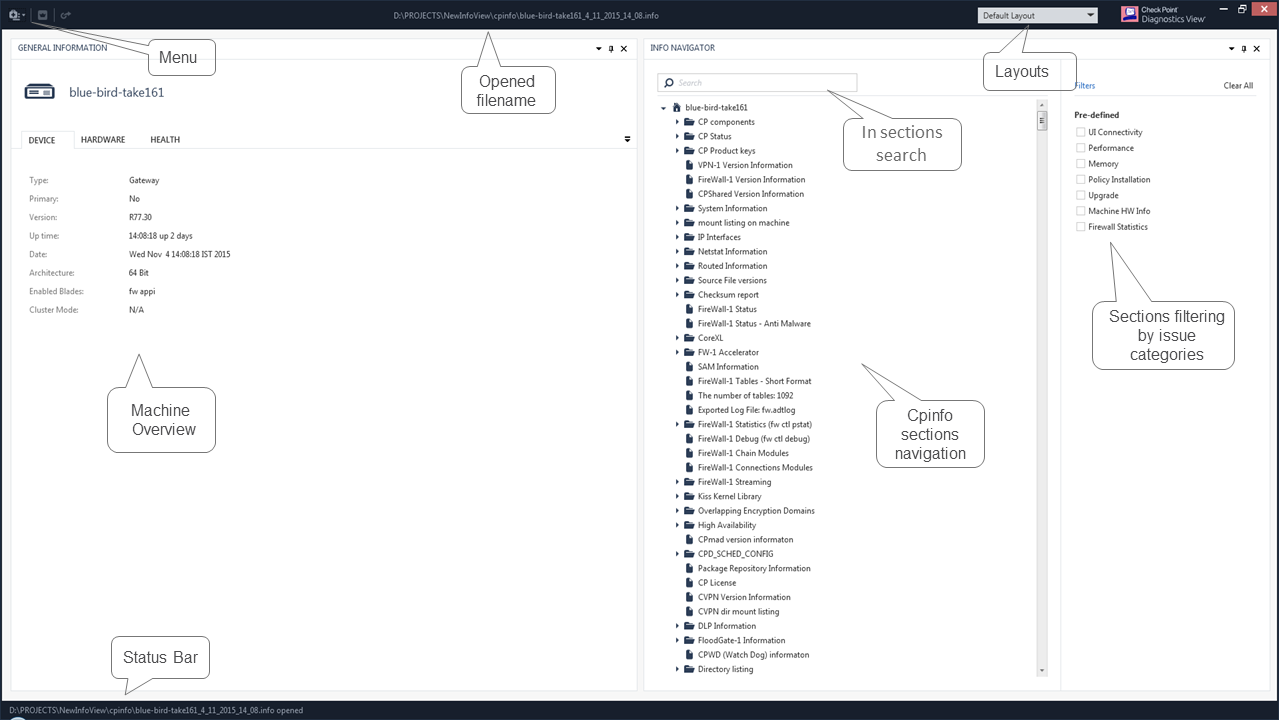
DiagnosticsView acts as a docking manager and consists of panels. Panels can be re-sized, dragged and re-arranged.
The default DiagnosticsView layout has two panels: **General Information** and **Info Navigator**.
(3) CPInfo File Open {#03}
==========================
You can open a [CPInfo](https://support.checkpoint.com/results/sk/sk92739) file in these ways:
* Double-click the CPInfo file (`*.info` or `*.cpinfo`).
* In a Windows File Explorer window, left-click the CPInfo file, drag it and drop it onto the DiagnosticsView window.
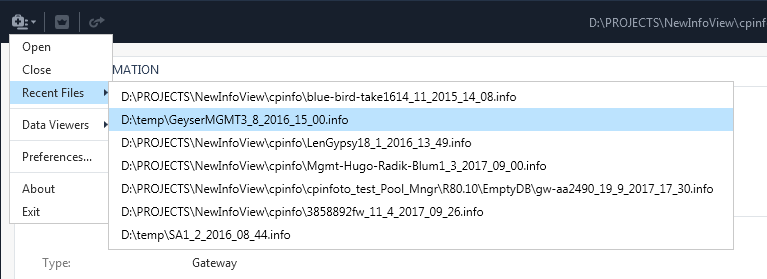
* In the top left corner, click **Menu** \> **Open**:

* In the top left corner, click **Menu** \> **Recent Files**:
**Notes:**
* DiagnosticsView supports the automatic opening of the CPInfo compressed output files (`.info.gz` and `.info.tar.gz`).
* When you open a file while another file is still open, DiagnosticsView will ask for your confirmation to close the previous file:
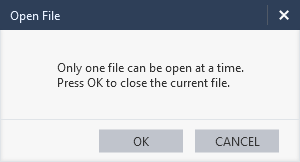
Clicking **OK** will close the previous file and open a requested file.
Clicking **Cancel** will keep the previous file and cancel another file open request.
(4) CPInfo Sections Navigation {#04}
====================================
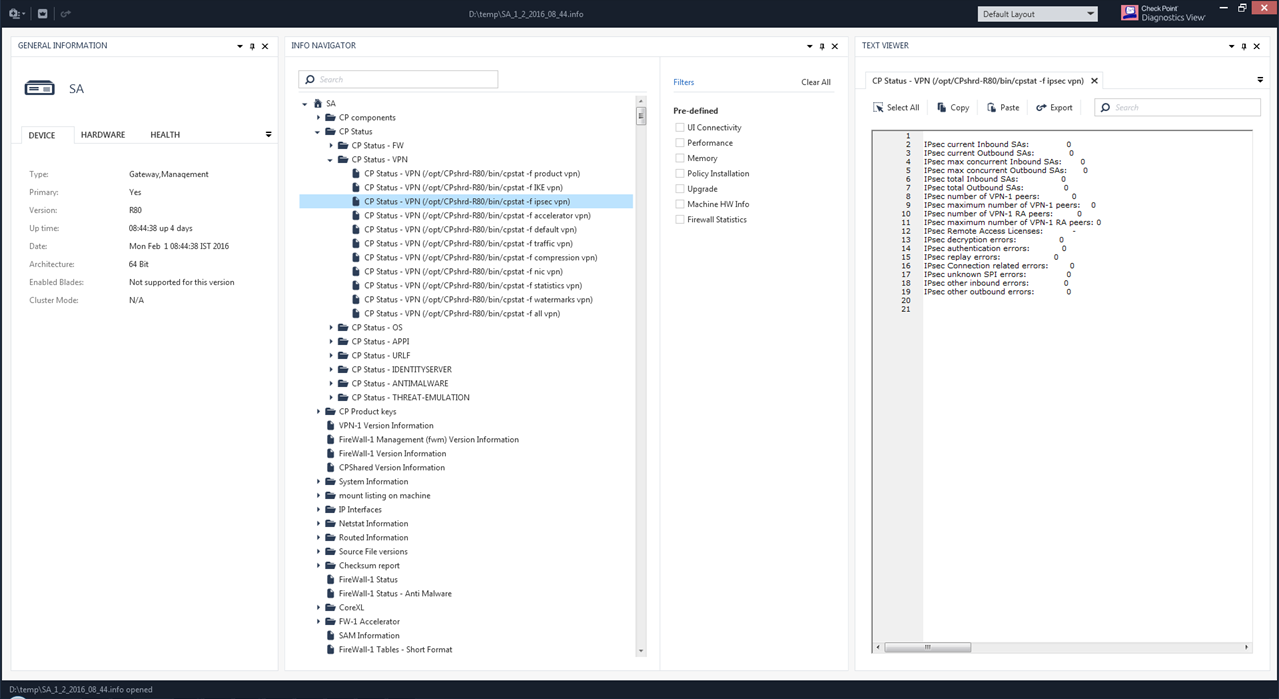
The Info Navigator panel includes a sections navigation tree. Navigate to the required section in the tree. Double-clicking on the section name will open this section in the appropriate Viewer:
**Note:** If the appropriate viewer is not found, double-click this section will not perform any action.
(4-A) Section Search / In-Section Search {#04-A}
------------------------------------------------
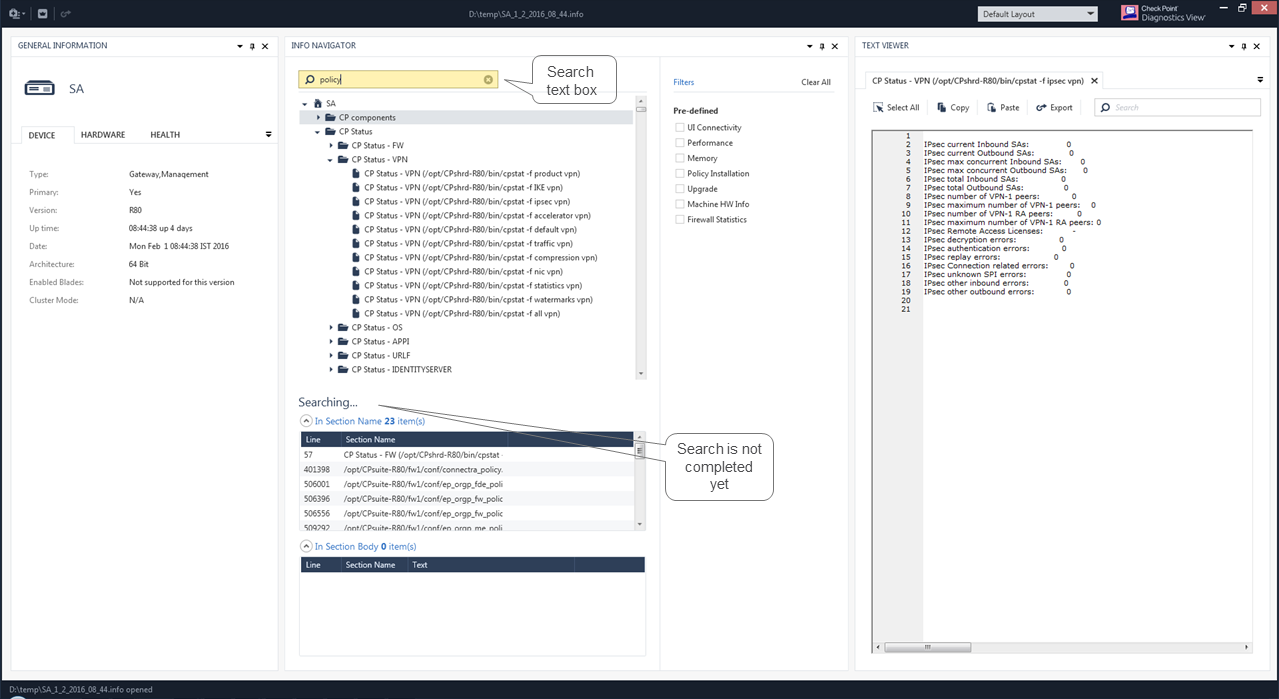
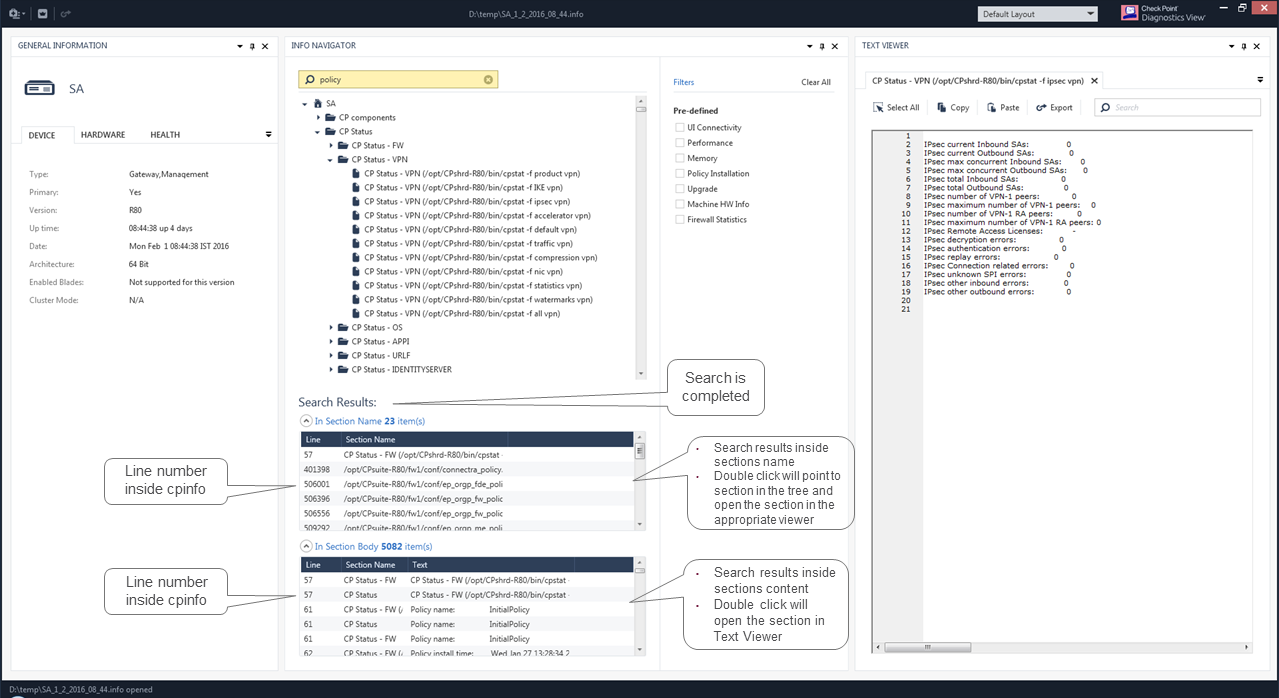
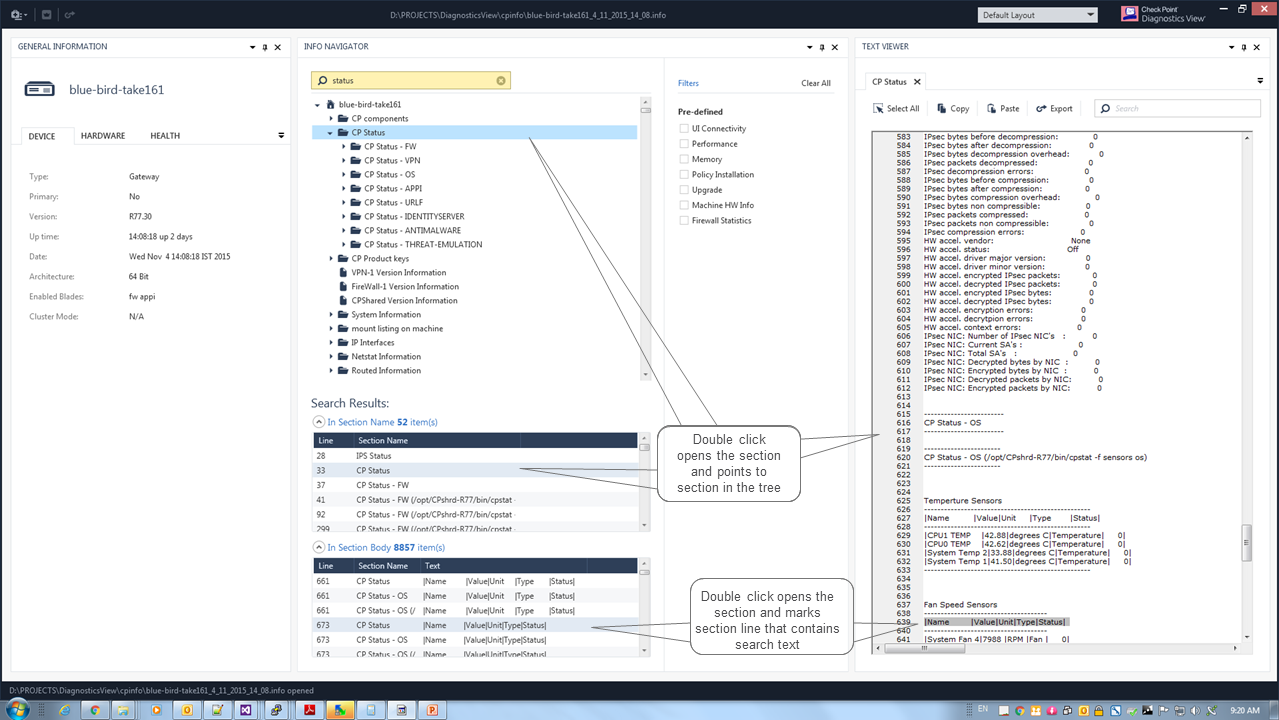
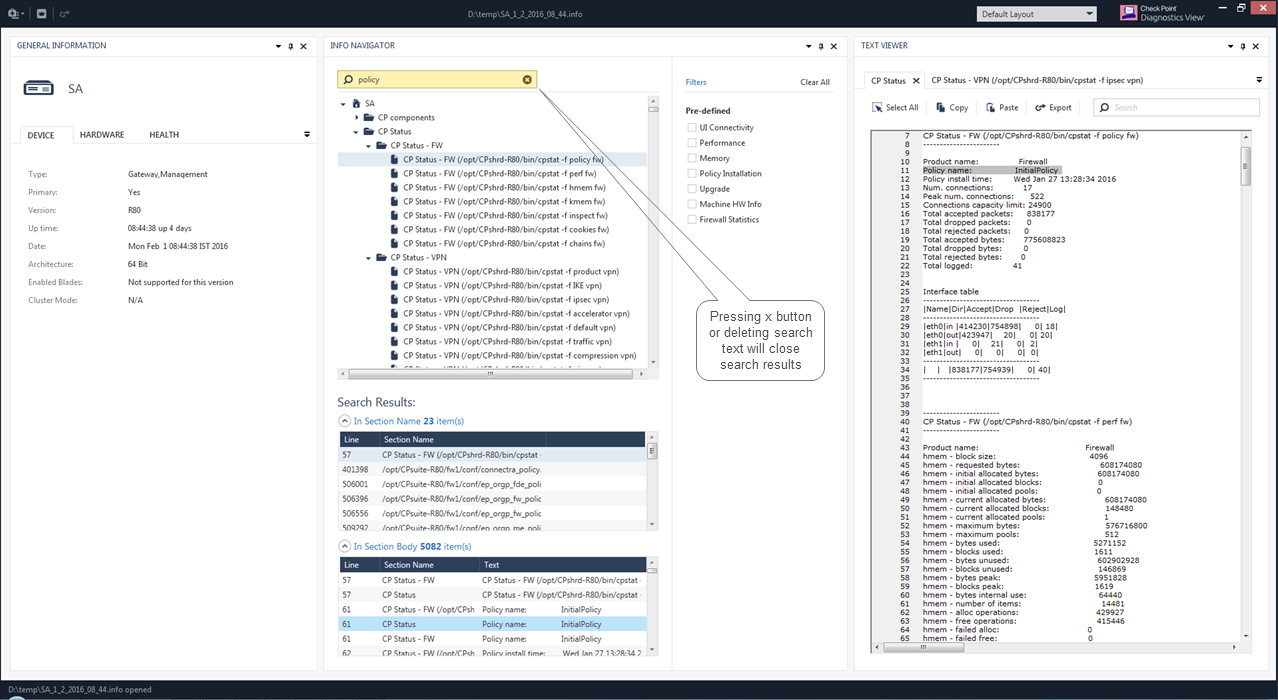
To search inside the CPInfo file, type your text in the search text box and press the Enter key.
**Note:** The search is not case-sensitive and matches the whole word.
Example search for "`policy`":
(4-B) Section Filtering {#04-B}
-------------------------------
If you are investigating a memory issue, you may want to see only memory sections in the navigation tree.
For this purpose, DiagnosticsView has pre-defined filters.
Choose the required filters to filter the navigation tree:
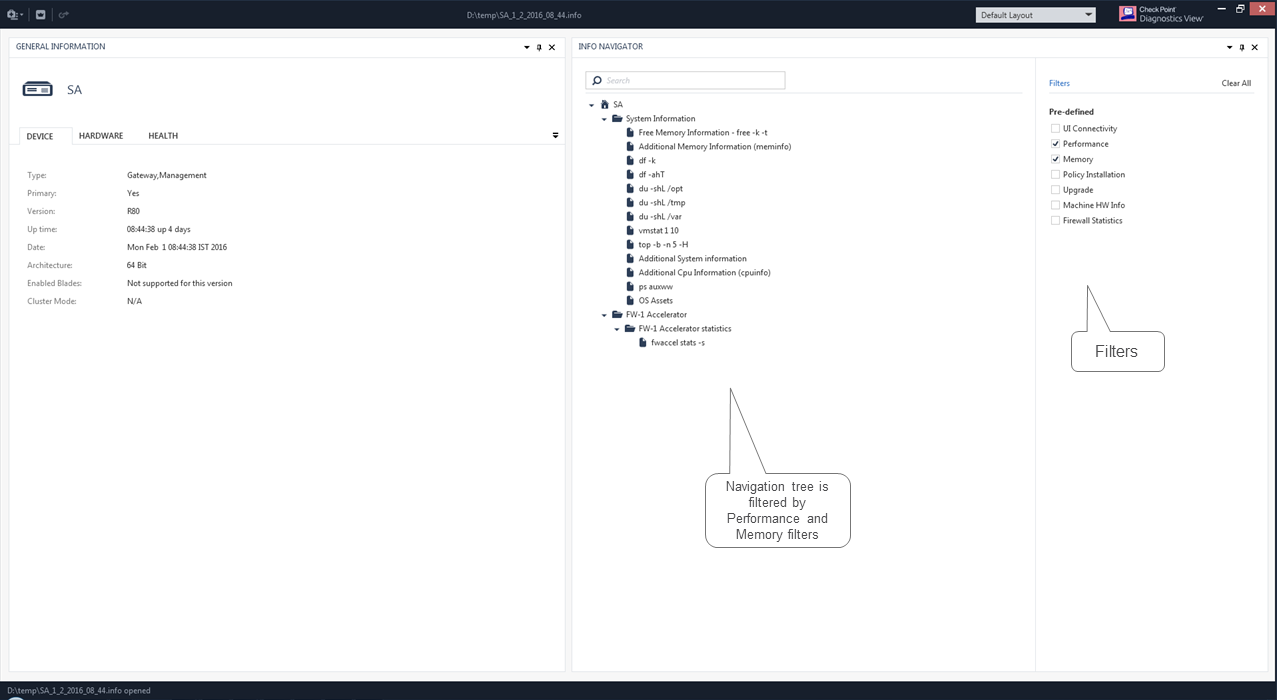
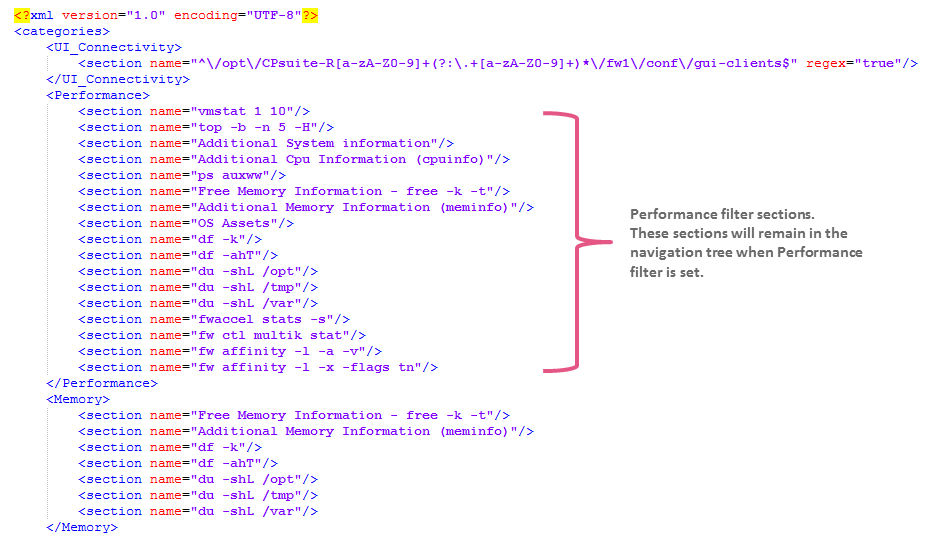
Filters and their content are completely configurable by xml file and can be adjusted by each group.
Filter content is defined by section elements. A section element has the following attributes:
* **name** - exact section name or a regular expression
* **regex** - set to true when the name is a regular expression
Workflow:
1. Create this file:
`C:\Users\%UserName%\AppData\Local\DiagnosticsView\Config\Categories.user.xml`
2. Edit the `Categories.user.xml` file in advanced text editor (like Notepad++).
3. Add your filters.
**Note:** You can see the predefined configuration in the `Categories.xml` file (typically located in `C:\Program Files (x86)\CheckPoint\DiagnosticsView\Config\Categories.xml`).
4. Save the changes in the file and close it.
Example file:
(4-C) Default Sections Data Viewer {#04-C}
------------------------------------------
You can configure the default section in the Data Viewer when you double-click the section name in the navigation tree:
1. Create this file:
`C:\Users\%UserName%\AppData\Local\DiagnosticsView\Config\SectionDefaults.user.xml`
2. Edit the `SectionDefaults.user.xml` file in advanced text editor (like Notepad++).
3. Add the required settings.
**Note:** You can see the predefined configuration in the `SectionDefaults.xml` file (typically located in `C:\Program Files (x86)\CheckPoint\DiagnosticsView\Config\SectionDefaults.xml`).
The XML file must contain this pattern:
```
```
Where:
* The '**name**' attribute is the CPInfo section name
* The '**dataViewer** ' attribute is the Data Viewer name ('`Text Viewer`' or '`Table Viewer`' or '`SQLite Viewer`')
* The '**regex** ' attribute - when is set to `true`, indicates that the '`name`' attribute is the regular expression to apply to the CPInfo section names
4. Save the changes in the file and close it.
(5) Layout {#05}
================
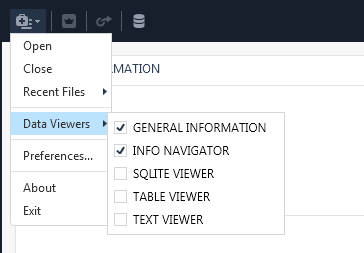
DiagnosticsView consists of panels. Each panel hosts Data Viewer. DiagnosticsView supports the following Data Viewers: General Information, Info Navigator, Text Viewer, Table Viewer and SQLite Viewer.
You can open / close Data Viewers in these ways:
* In the top left corner, click **Menu** \> **Data Viewers** \> click the applicable viewer:
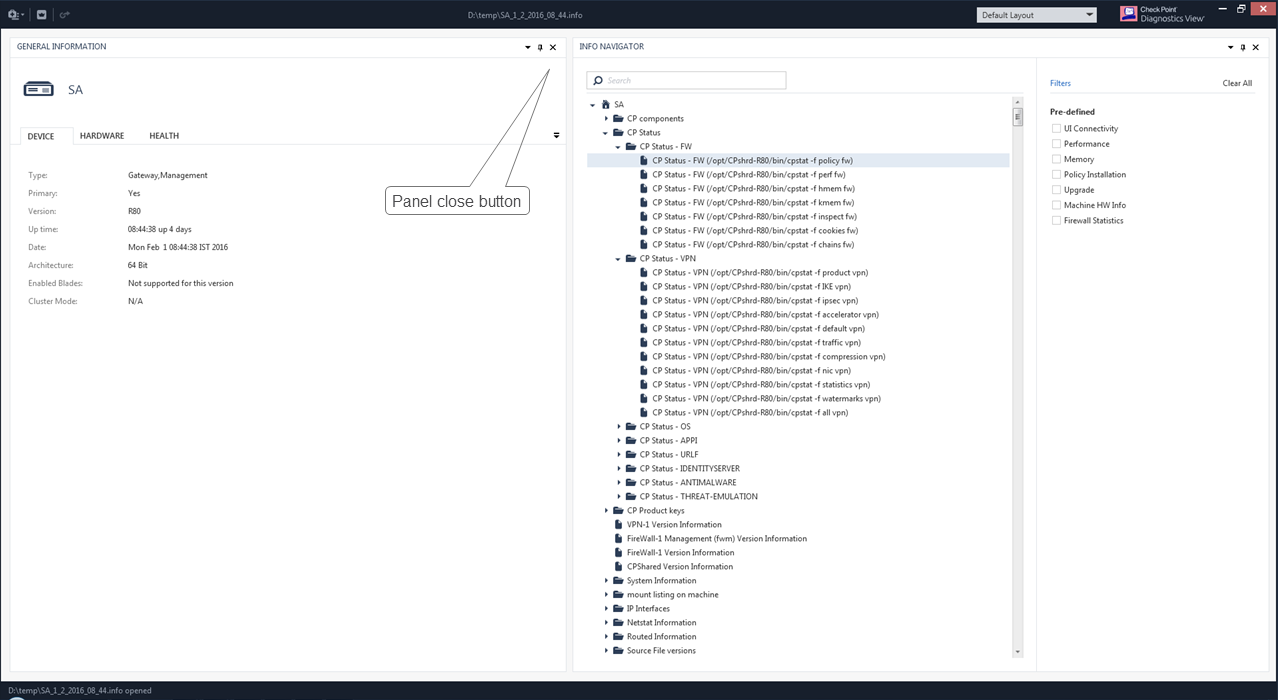
* Click the "X" button in panel's top right corner:
* Double-click the section name in the navigation tree.
For your convenience, you can resize panels and drag panels to different locations.
To save your layout for the next DiagnosticsView launch:
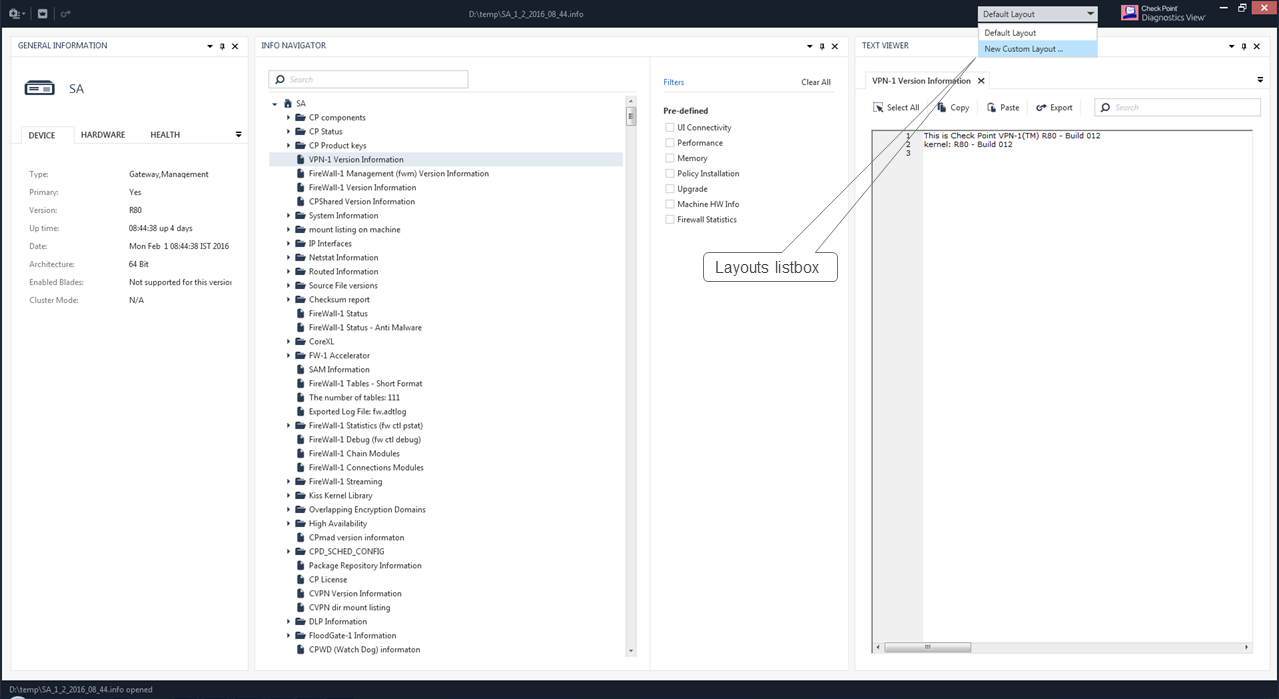
1. Click in the Layout drop-down in top right corner and click **New Custom Layout**:
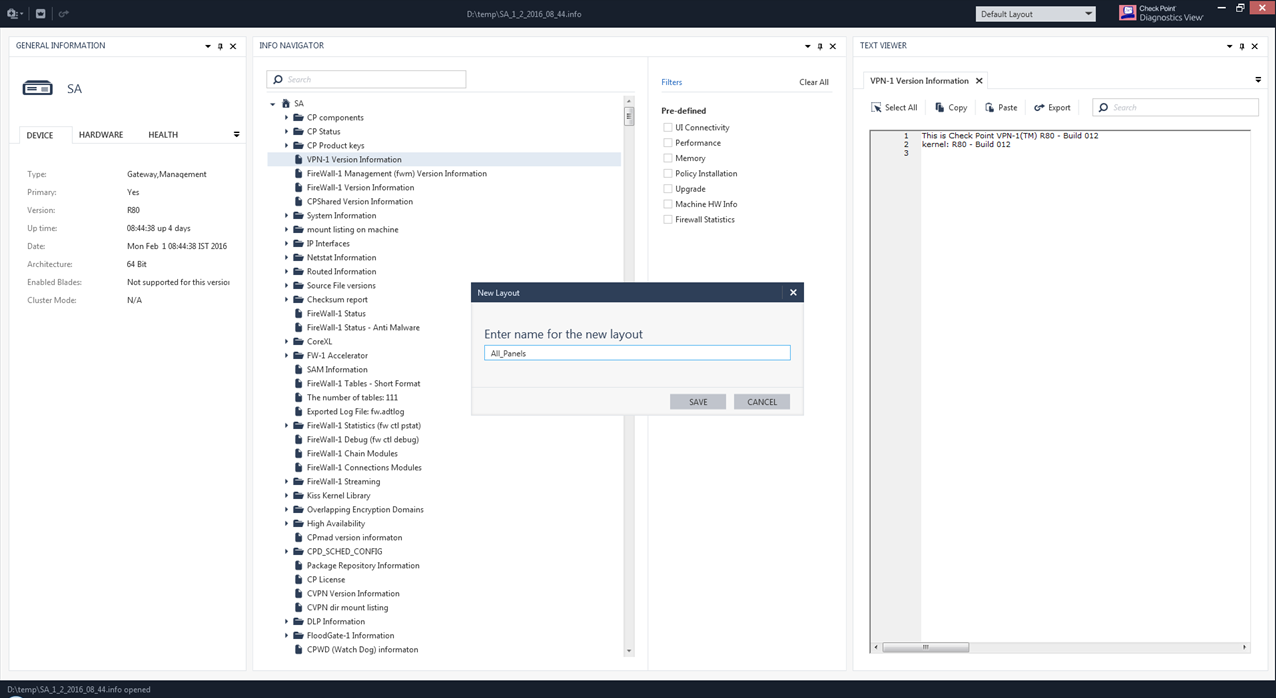
2. A **New Layout** window opens.
Type the name of your layout and click the **Save** button:
You can save several layouts and switch between them.
During the next launch, DiagnosticsView will use the last layout you used.
(6) Policy View {#06}
=====================
If the CPInfo output file is from a Security Management Server or a Standalone Server, then DiagnosticsView shows the Security Gateway object and especially the policies in the SmartConsole.
Make sure you have the appropriate version of SmartConsole installed on your desktop.
**Note:** Policy View is not supported for CPinfo files collected on the Multi-Domain Security Management Server.
(6-A) R80 and above {#06_R8x}
-----------------------------
To view the policy from a Management Server R80 and above, prepare a Virtual Machine (VM) that meets these requirements:
* Runs the same Check Point version as the Management Server, on which the CPinfo file was collected.
* Has the SFTP server enabled.
* Has the interface "*eth1* " interface, which is not the main interface (this interface *eth1* can be down).
The CPinfo utility on a Management Server R80 and above creates two files:
* CPinfo file = `*.info`
* Database export file = `*_ migrate_export_out.tgz`
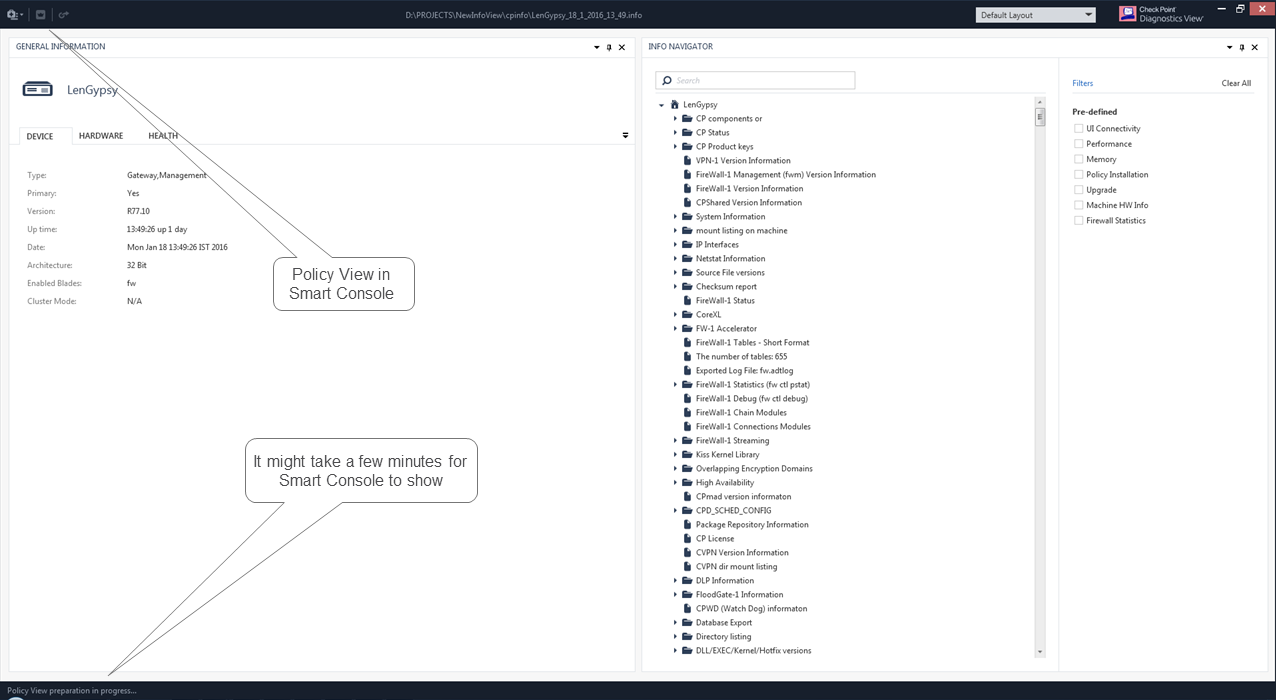
To view the policy, click the **Policy View** button located on the top toolbar near the **Menu** button:
When you click this button, the **Policy View** preparation window will be displayed and will specify the VM credentials and Database export file.
**Note:** If the Database export file is located in the same folder as the CPinfo file, DiagnosticsView will automatically detect it.
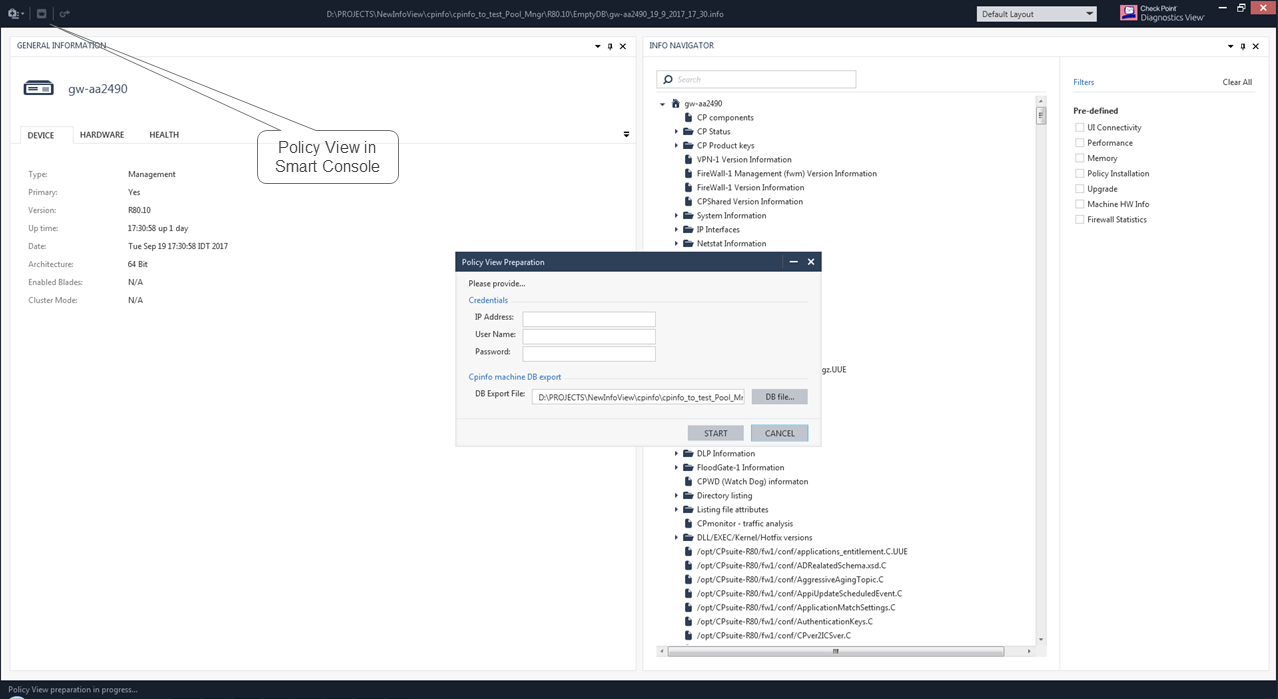
Specify your VM credentials, the database export file, and click **Start**. This starts the VM preparation by importing the specified Database file. This might take a long time to complete.
When the VM is ready, SmartConsole will be launched.
### (6-A) R80 and above - Pool Manager {#06_R8x_PM}
> Instead of creating the VM manually, there is an option to work with Pool Manager based on the MySQL server that manages VMs created in advance (regional TAC is responsible for VM Pool creation).
>
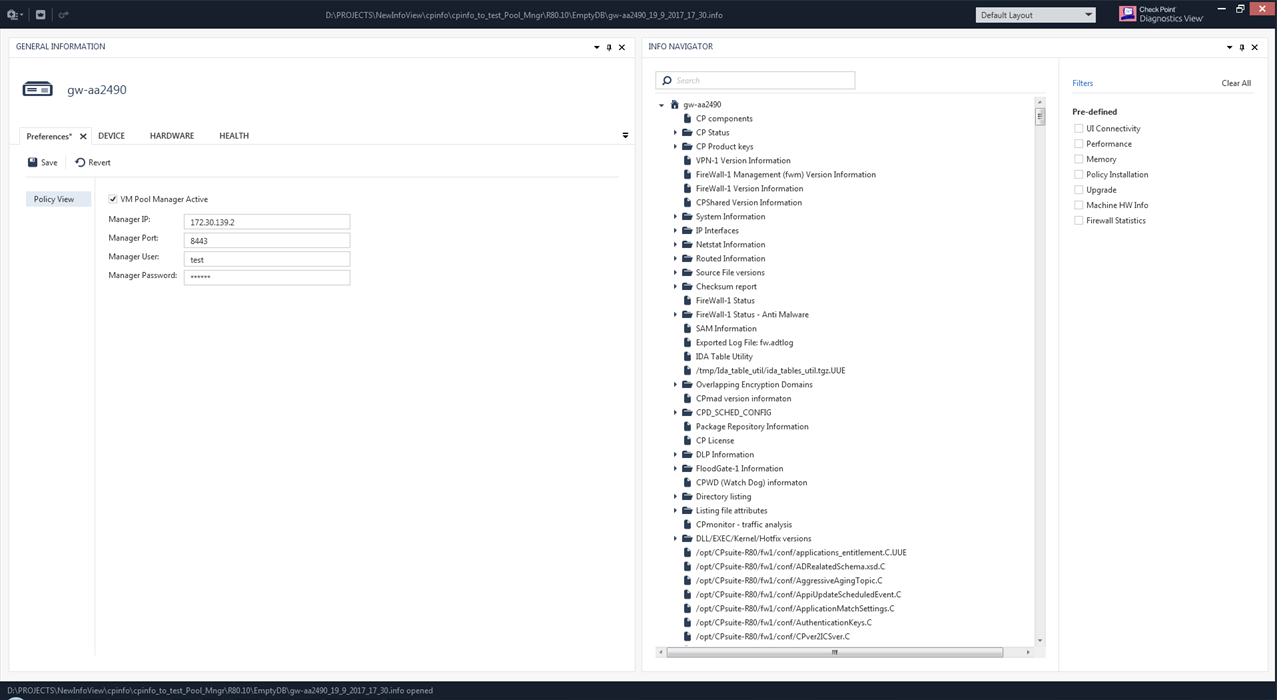
> To enable this option:
>
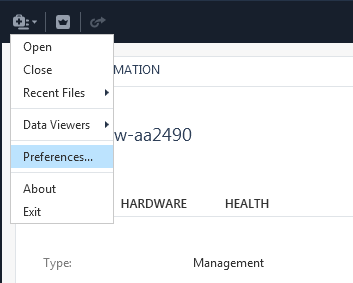
> 1. Click **Menu** -\> **Preferences**.
>
> 
> 2. Click **Policy View**.
>
> 3. Select the option **VM Pool Manager Active**.
>
> 4. Specify the Pool Manager credentials.
>
> 5. Click the **Save** button.
>
> Example:
>
> 
>
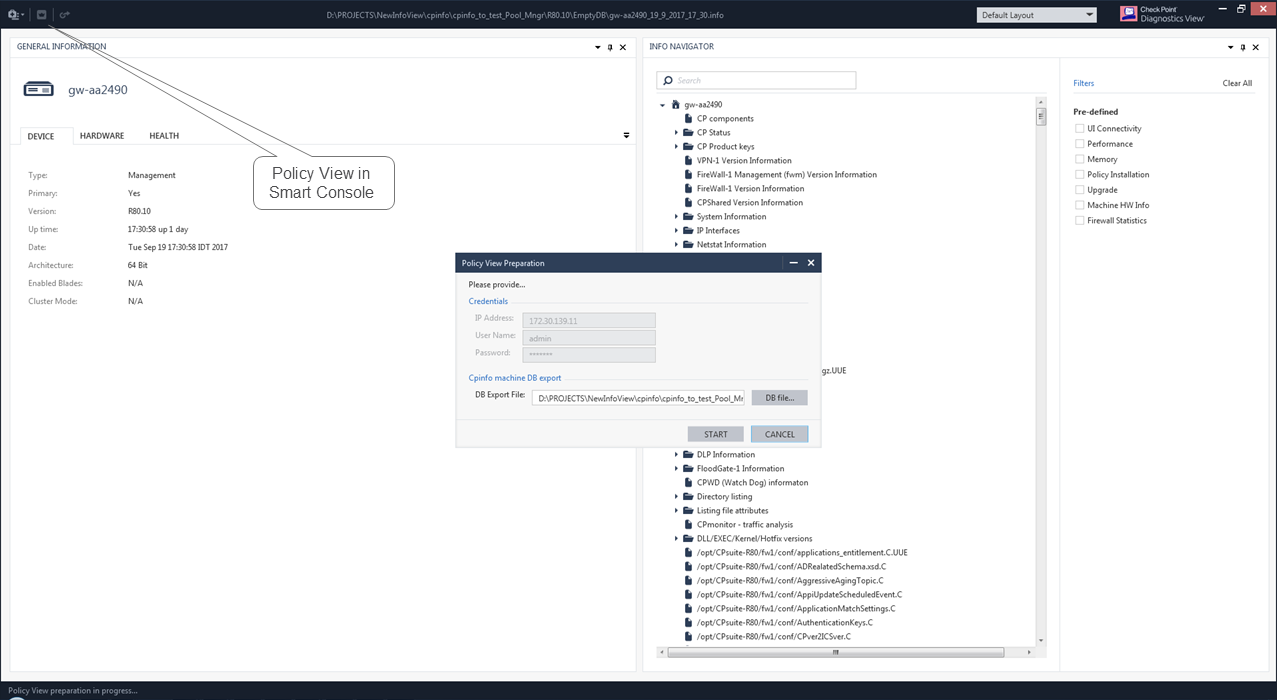
> Now, when the VM Pool Manager is active, by clicking on the Policy View icon you will not be asked to provide the VM credentials.
>
> DiagnosticsView will automatically obtain the VM credentials from the Pool Manager:
>
> 
>
> Specify the Database export file and click **Start**. This starts the VM preparation by importing the specified Database file. This might take a long time to complete.
>
> When the VM is ready, SmartConsole will be launched.
### (6-A) R80 and above - Export VM from Pool Manager {#06_R8x_PM_Export}
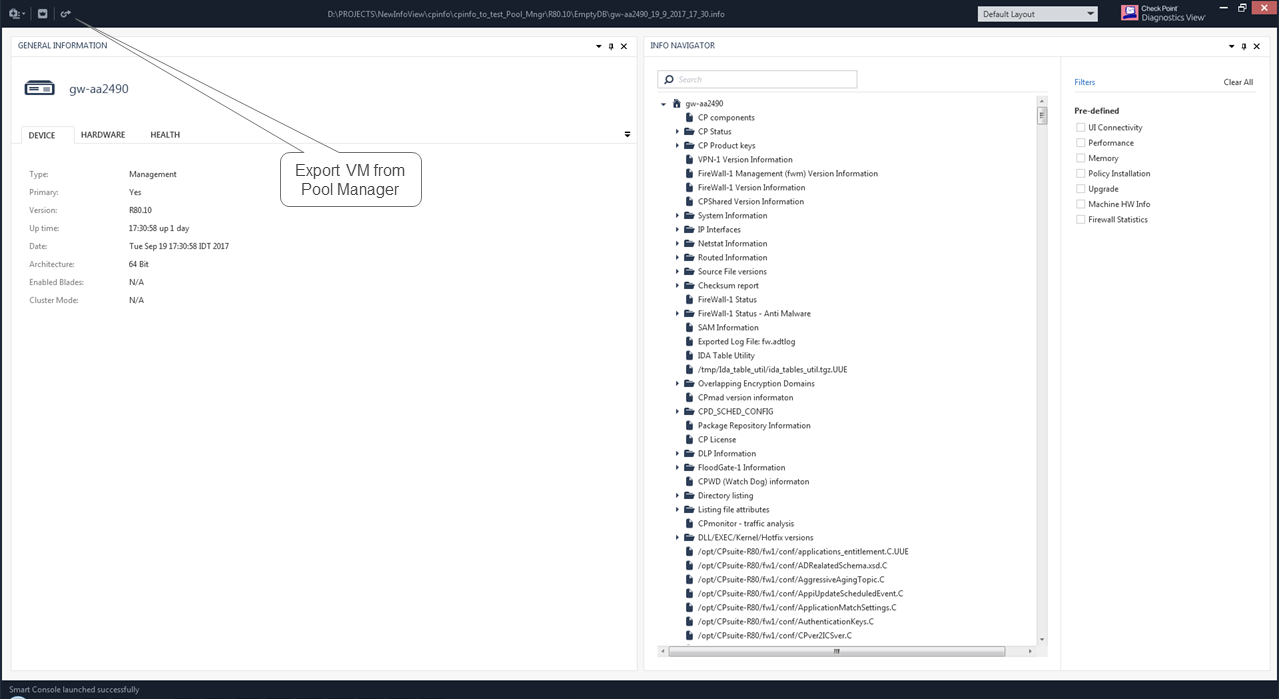
> When you close the CPInfo file, the pool VM is released.
>
> If you want to keep it, you have the option to export this VM.
>
> 1. Click the **Export VM** button before closing the CPInfo file.
>
> **Note:** The maximal VM usage is 24 hours (Pool Manager configuration). This means that even if the CPInfo file is open for more than 24 hours, the VM will be released by the Pool Manager. You will be informed by email.
>
> 
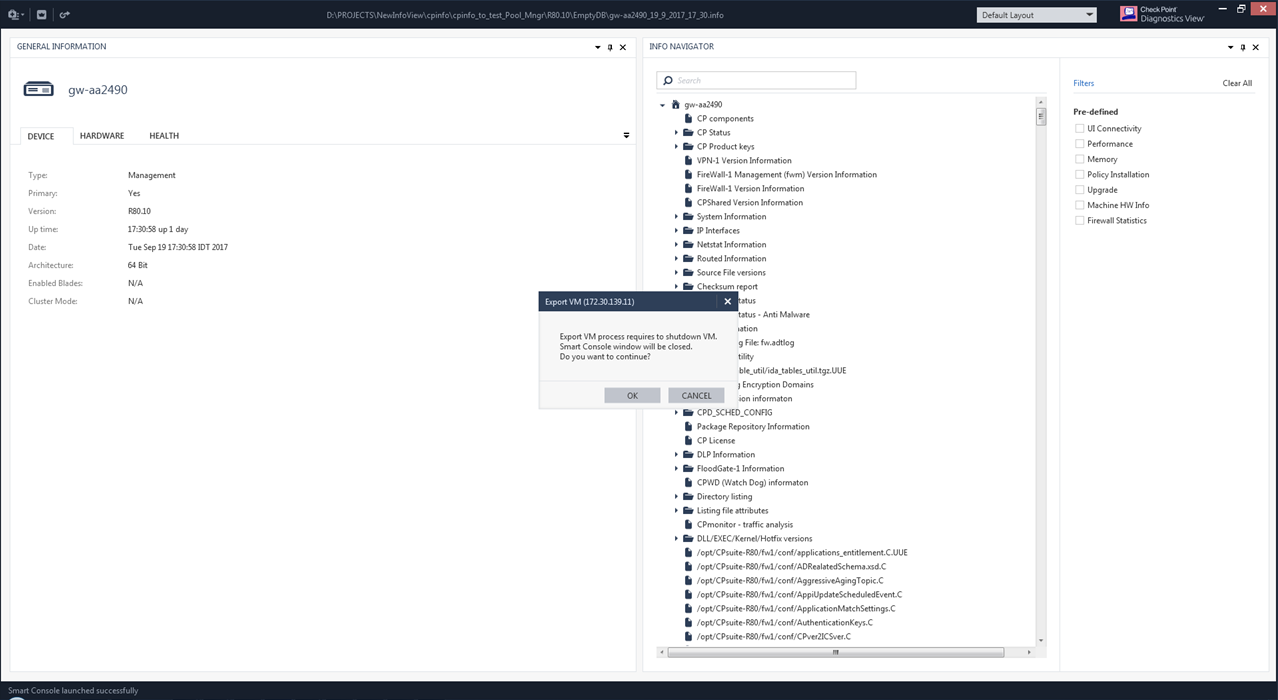
> 2. Click **OK** to continue:
>
> 
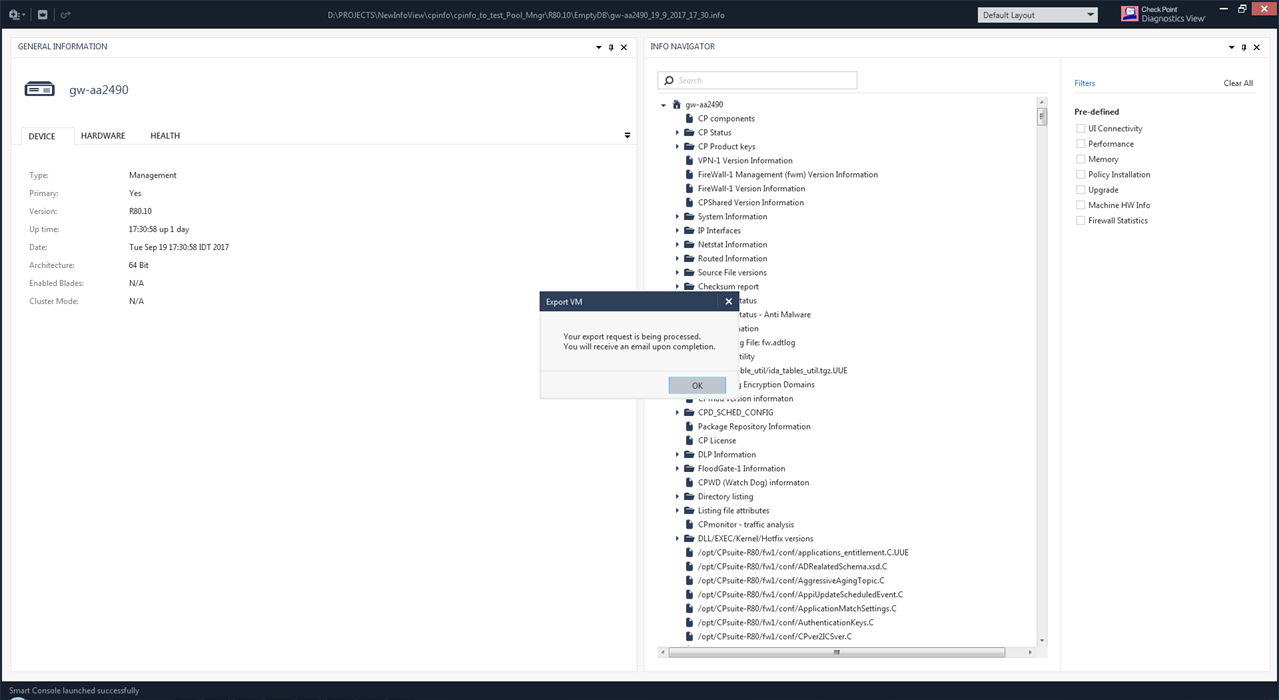
> 3. Click **OK** to start the export:
>
> 
> 4. Now you can close CPInfo file.
(6-B) R77.30 and below {#06_R77x}
---------------------------------
To view the policy, click the **Policy View** button located on the top toolbar near the **Menu** button:
(7) Text Viewer {#07}
=====================
Text Viewer is a built-in viewer and editor of CPInfo sections.
You can open the Text Viewer in these ways:
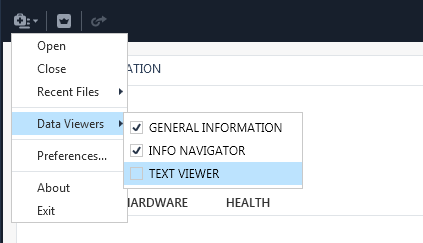
* In the top left corner, click **Menu** \> **Data Viewers** \> **Text Viewer**:
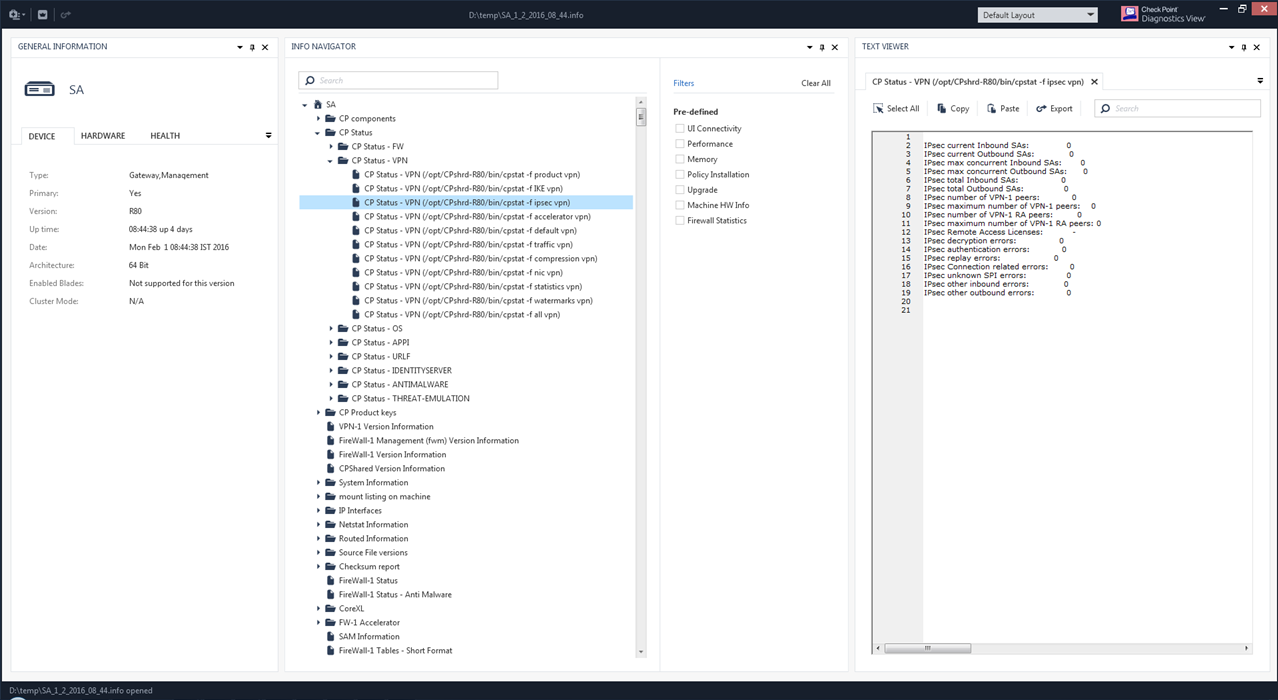
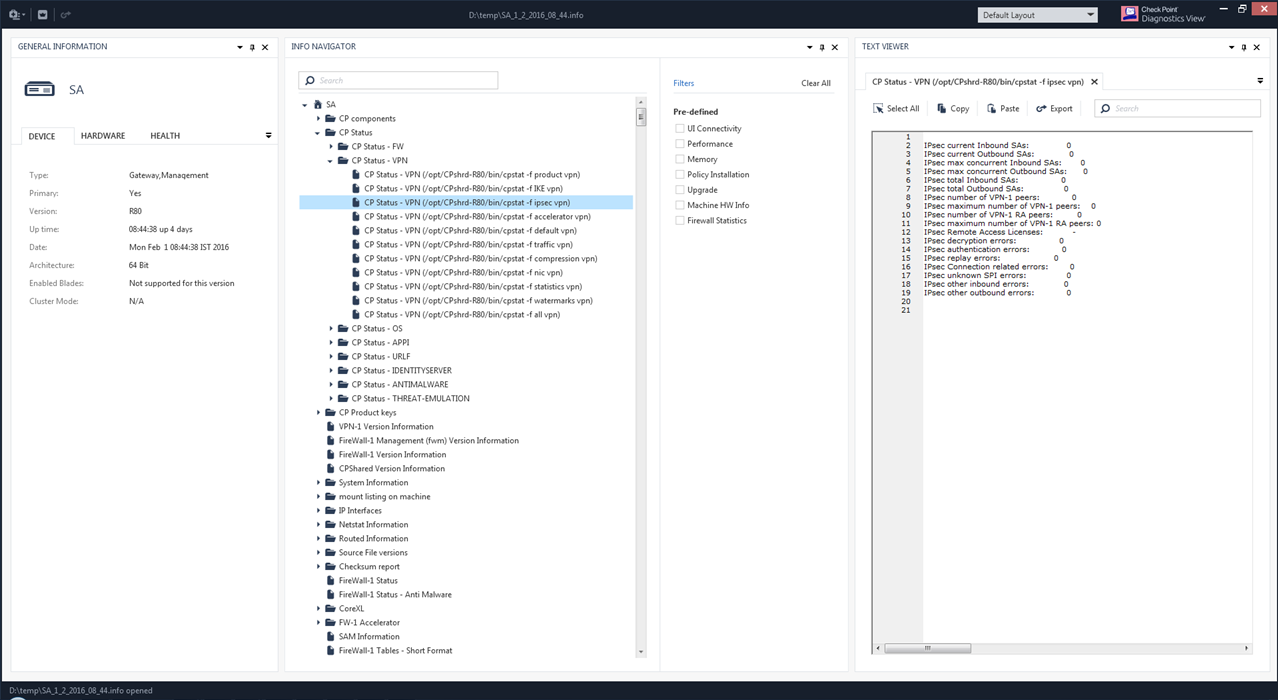
* Double-click the section name in the navigation tree (only suitable sections will be displayed by the Text Viewer):
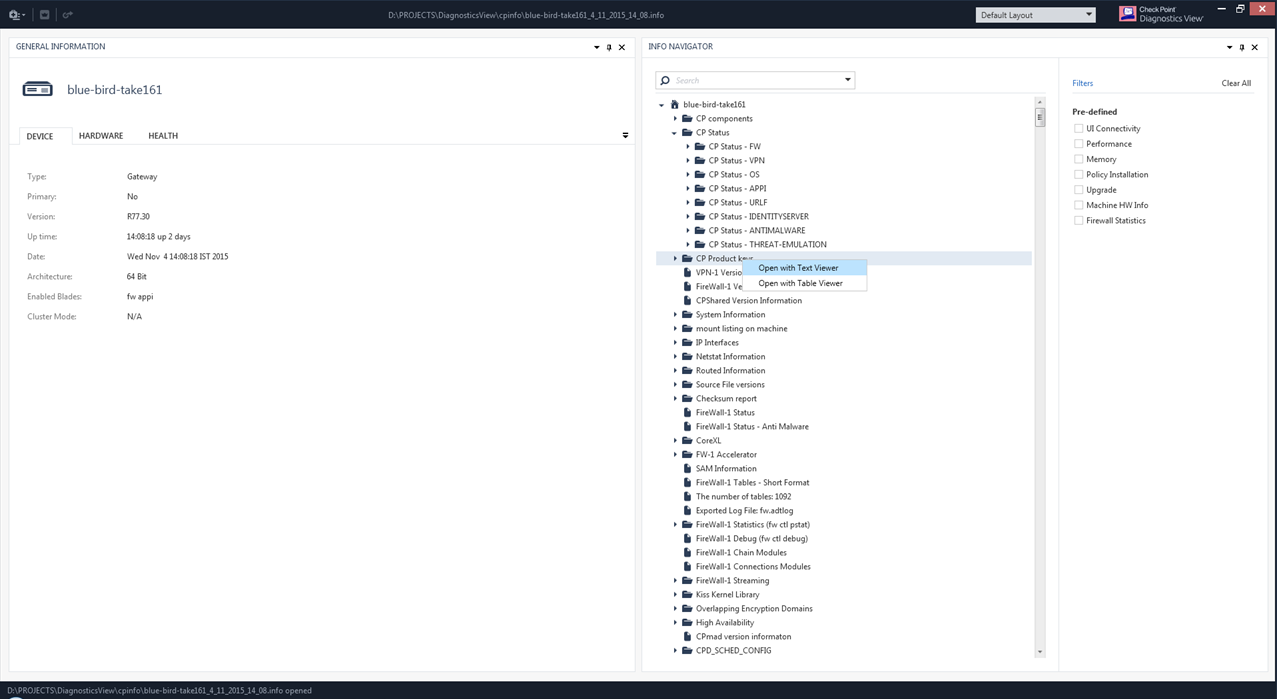
* Right-click the section name in the navigation tree and click **Open with Text Viewer**:
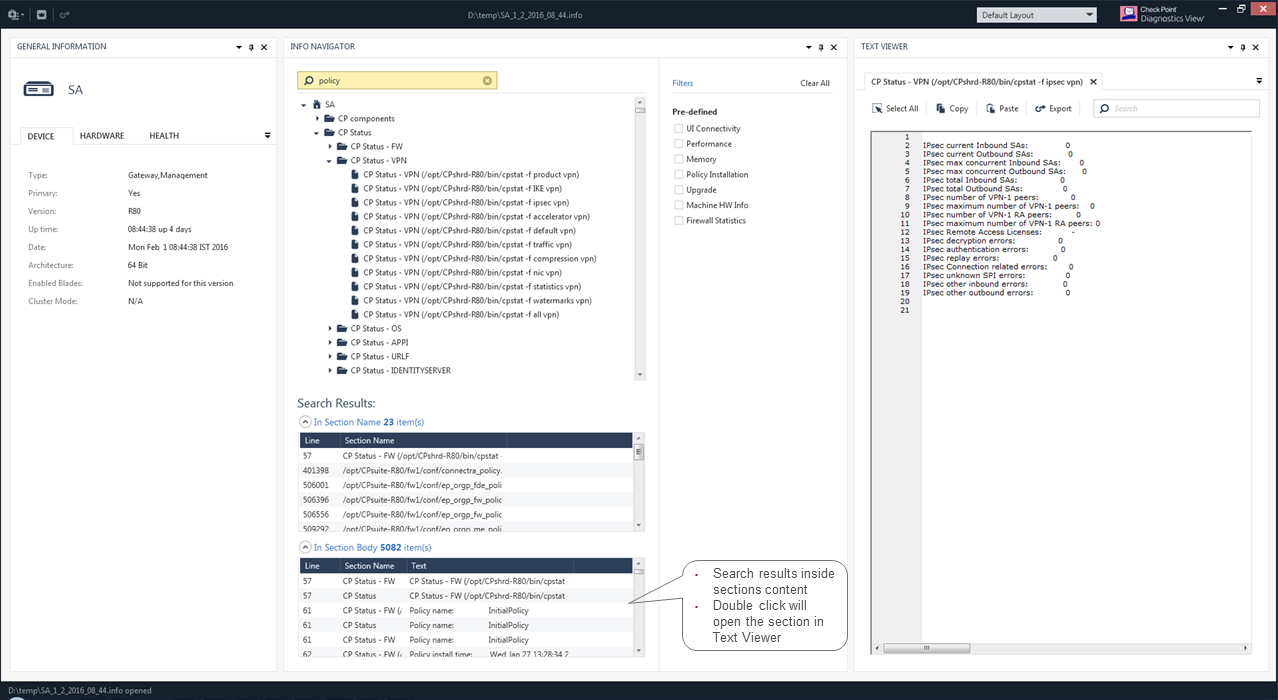
* Double-click the search result inside the section's content:
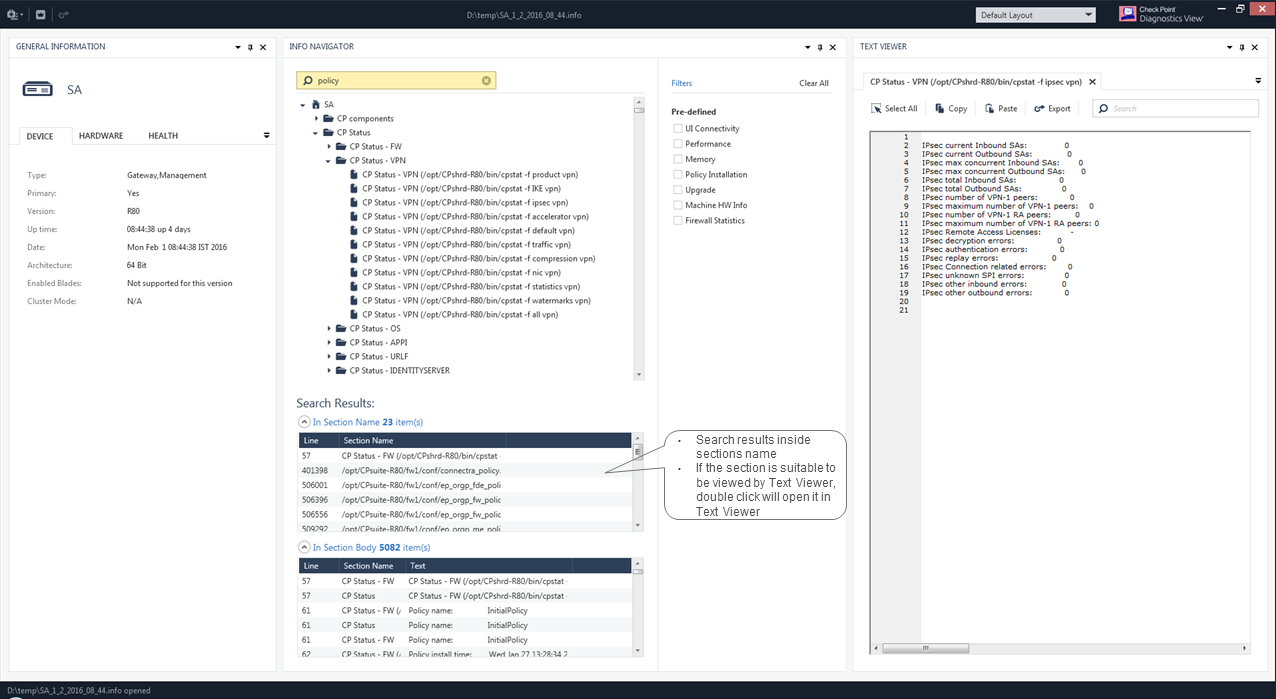
* Double-click the search result inside the section's name (if the section is suitable for viewing by the Text Viewer):
By default, all sections inside Text Viewer have a tabbed view:
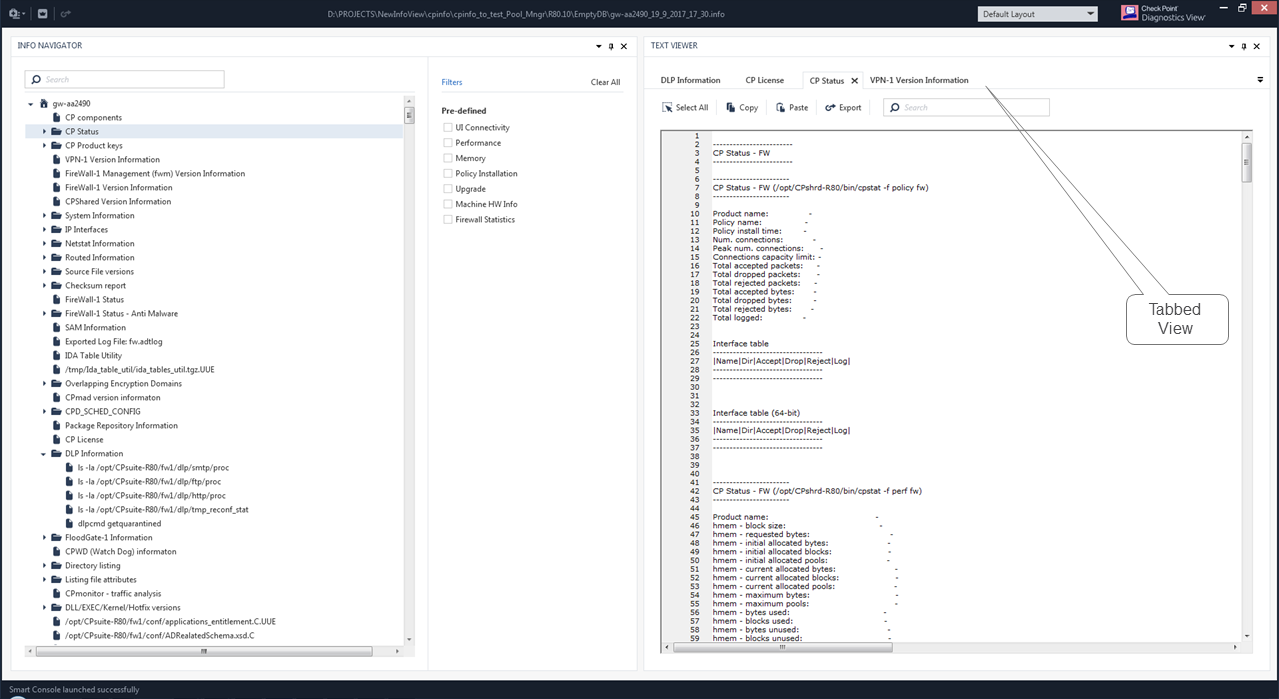
You can drag the section and change its location:
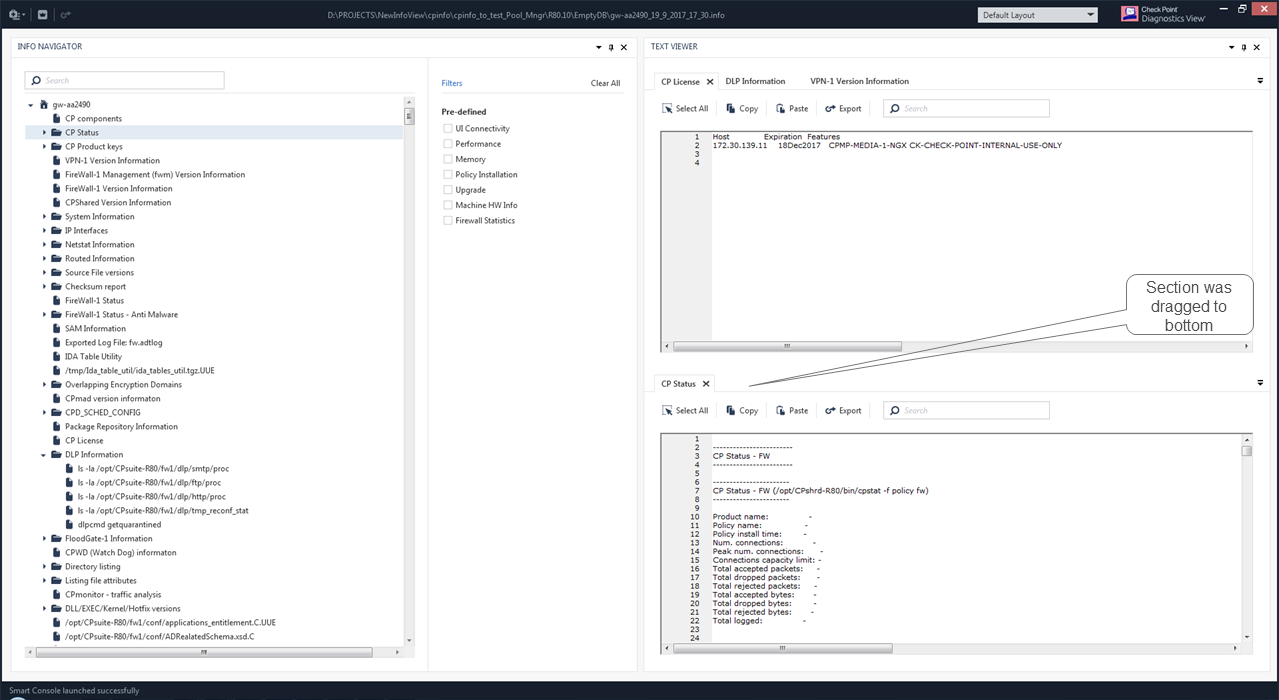
TextViewer allows you to edit the CPInfo section. The original CPInfo file will not be changed.
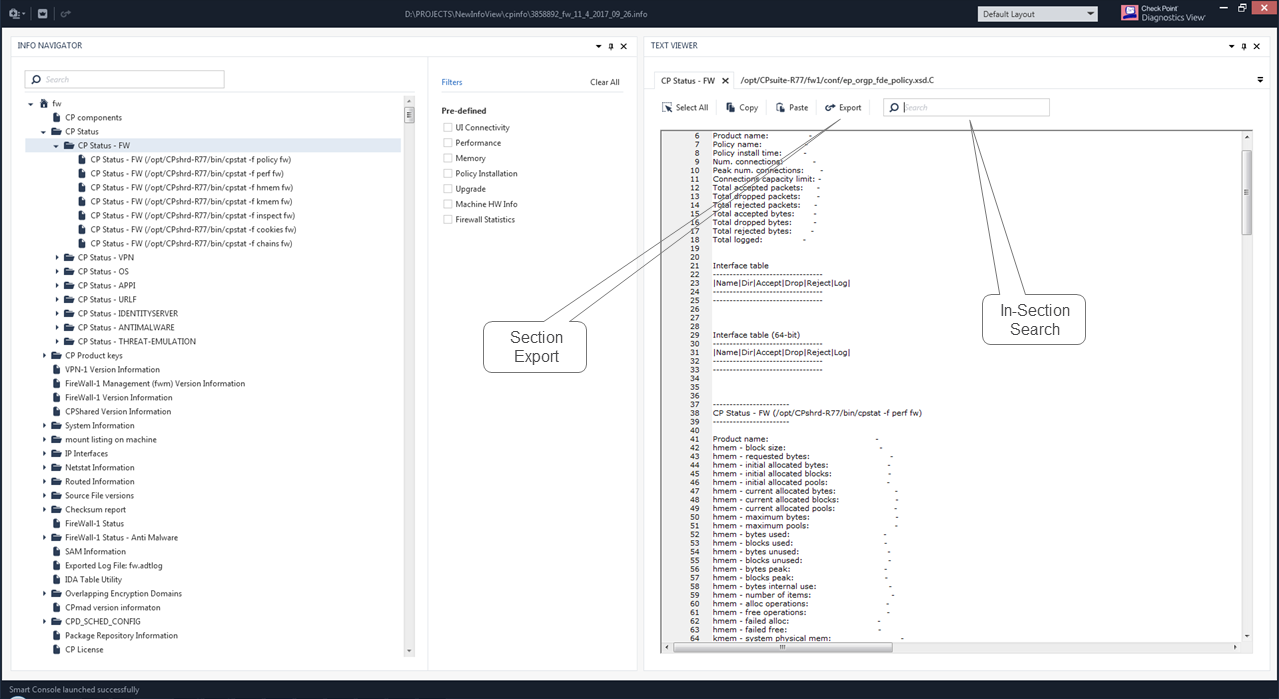
If you want to save an edited section, click the **Export** button to save it as a separate file.
To search inside the section, type the search text in the search text box and press the Enter key. The search is cyclic. Pressing Enter repeatedly will find the next text appearance.
**Note:** Pressing the CTRL + F keys will locate the cursor in the search text box.
(8) Table Viewer {#08}
======================
Table Viewer is a built-in viewer of the CPInfo sections.
Table Viewer will try to detect table structures within the section based on separators and predefined patterns.
Section data that is not recognized as a table will be presented as 'Unstructured Text'.
If the section contains tables that are not recognized by the Table Viewer, the table format can be defined in the configuration file as described below.
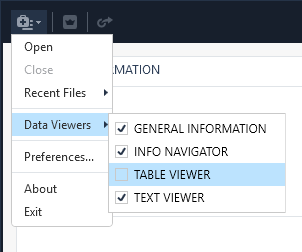
You can open the Table Viewer in these ways:
* In the top left corner, click **Menu** \> **Data Viewers** \> **Table Viewer**:
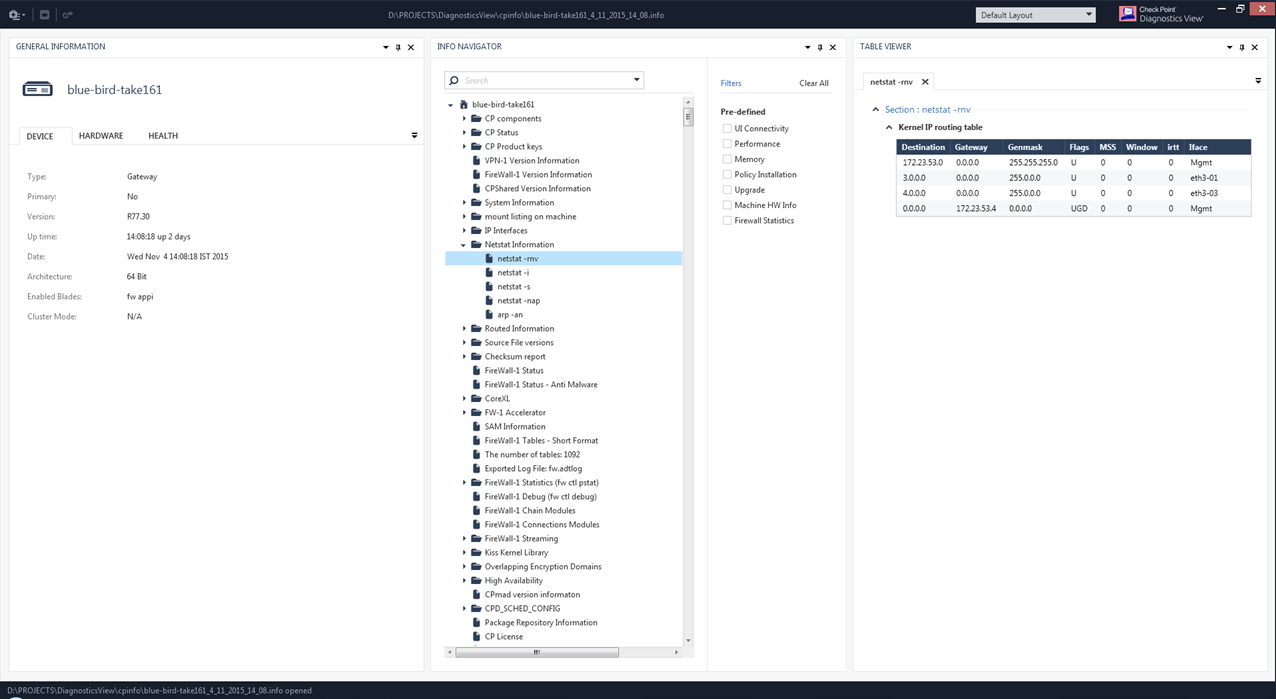
* Double-click the section name in the navigation tree (only suitable sections will be displayed by the Table Viewer):
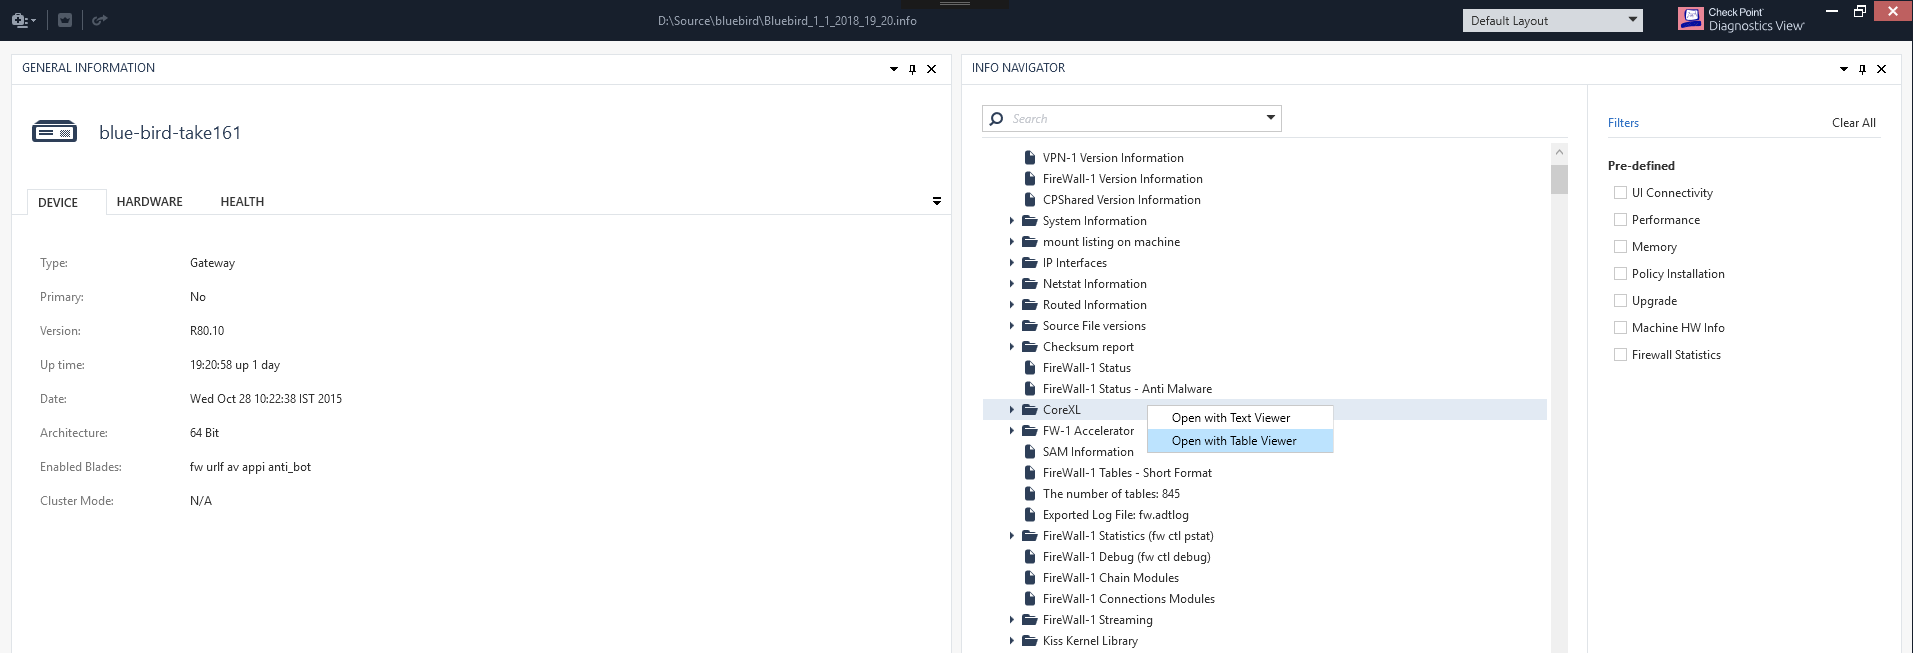
* Right-click the section name in the navigation tree and click **Open with Table Viewer**:
* Double-click the search result inside the section name (if the section is suitable for viewing by the Table Viewer):
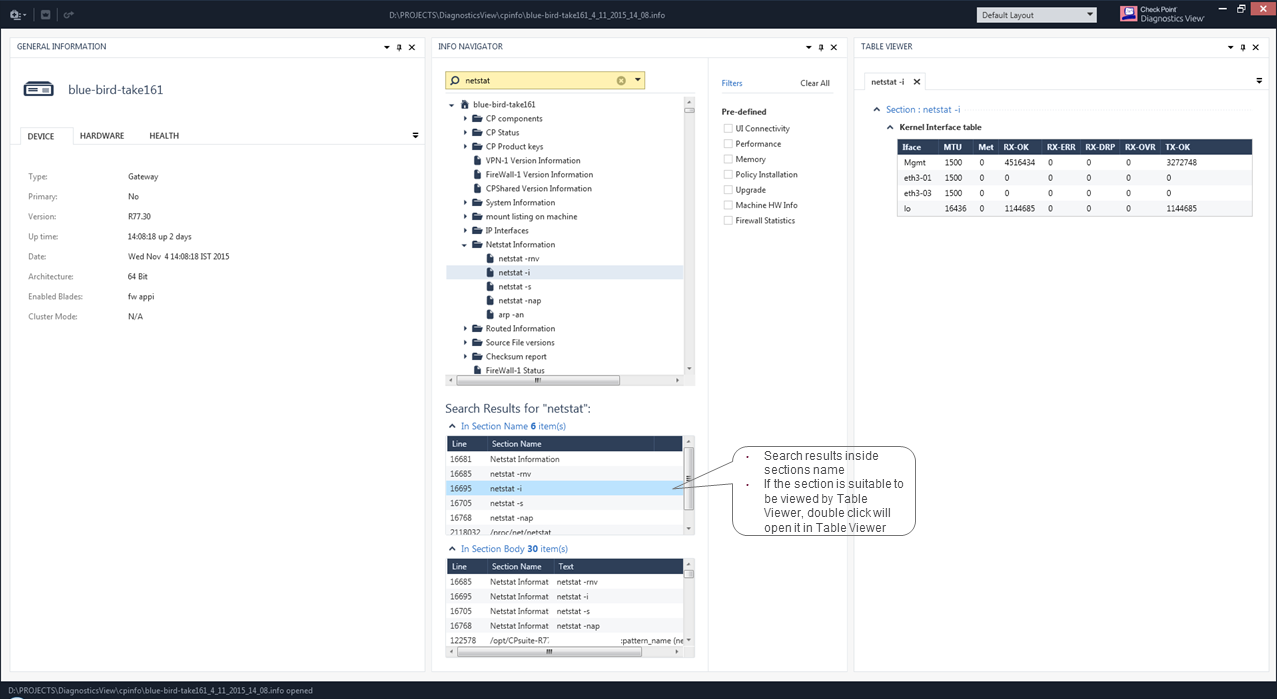
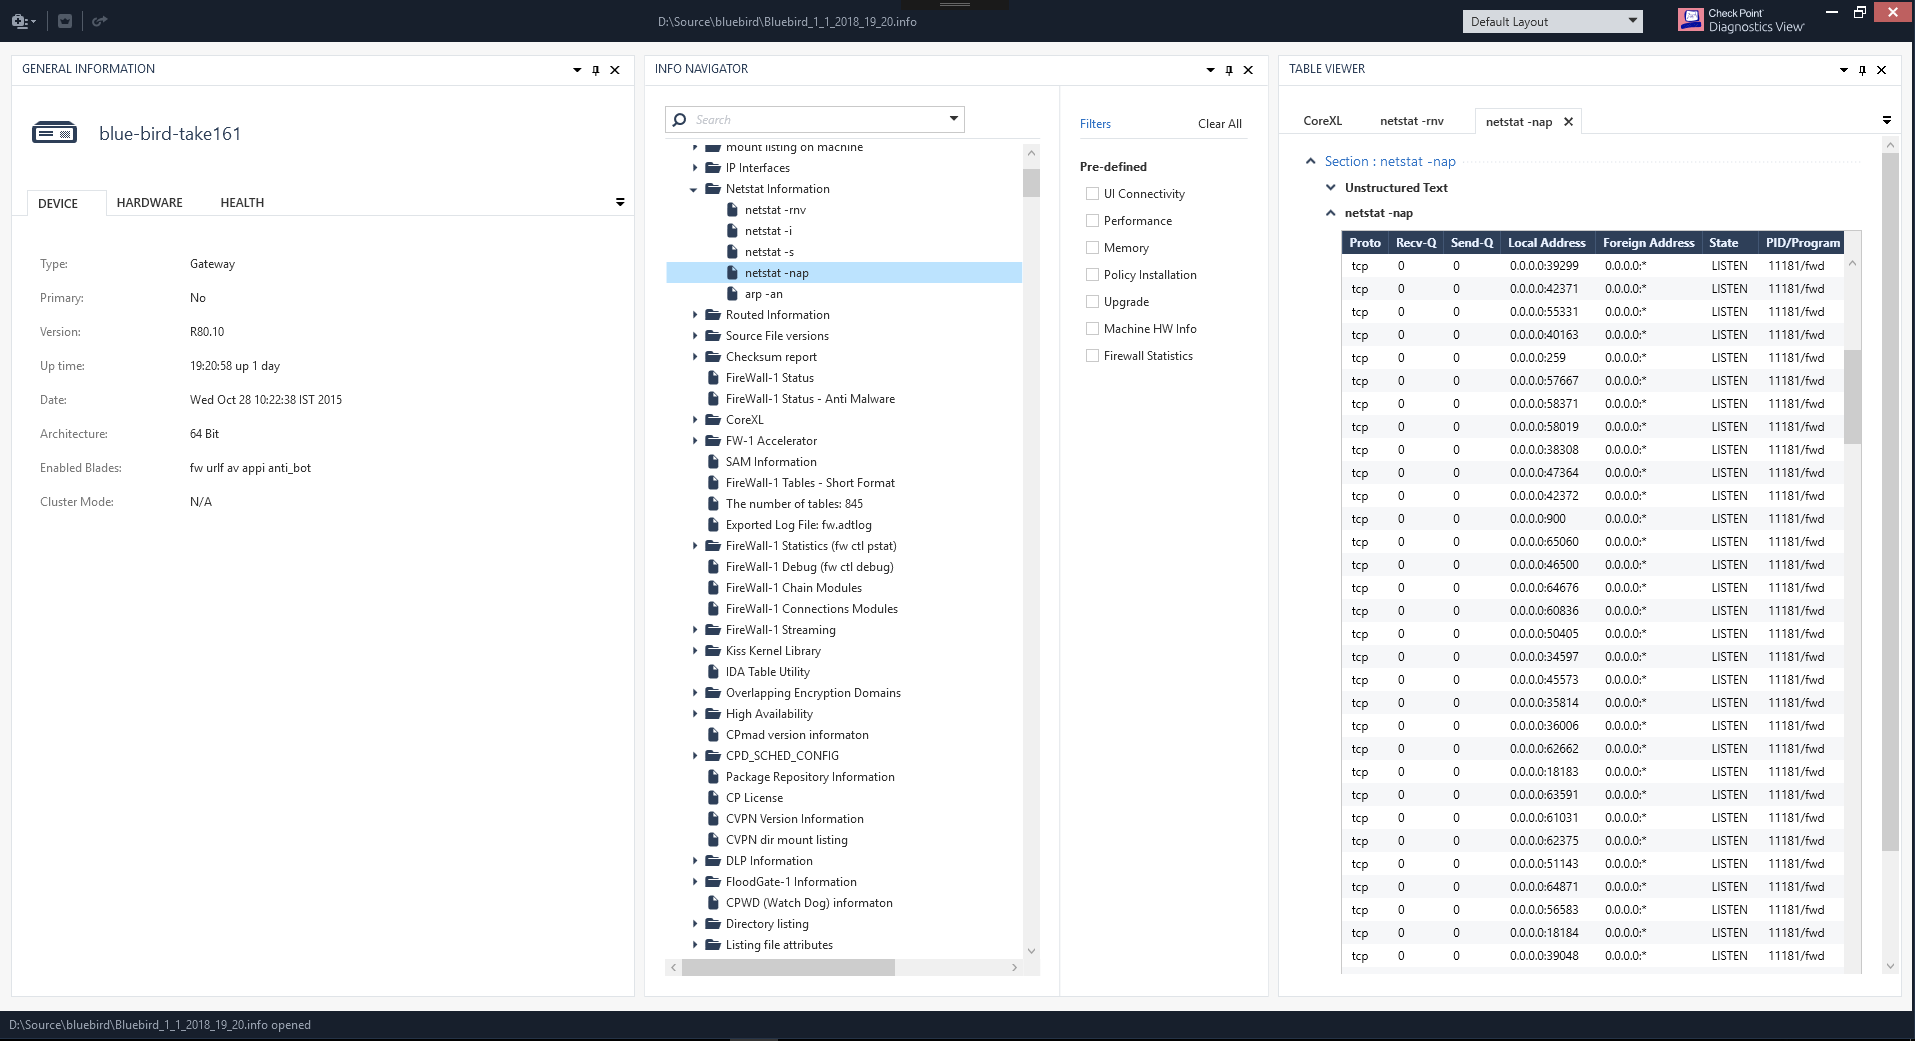
Table Viewer has a tabbed view like Text Viewer.
Table format data will be presented as tables. Section data that is not recognized as a table will be presented as 'Unstructured Text' and can be expanded with a mouse click:
You can configure sections that contain tables and are not recognized by the Table Viewer.
Workflow:
1. Create this file:
`C:\Users\%UserName%\AppData\Local\DiagnosticsView\Config\TableViewPrefs.user.xml`
2. Edit the `TableViewPrefs.user.xml` file in advanced text editor (like Notepad++).
3. Configure the required settings.
**Note:** You can see the predefined configuration in the `TableViewPrefs.xml` file (typically located in `C:\Program Files (x86)\CheckPoint\DiagnosticsView\Config\TableViewPrefs.xml`).
XML file must contains this pattern:
>
> ```
>
>
>
>
>
> ```
Where:
* The '**name**' attribute is the CPInfo section name.
* Every section can be parsed using a separators list or a regex.
* When the headers sector is defined, these headers will be attached to all the tables in the section. If no headers are defined, the first table line will be used as headers.
4. Save the changes in the file and close it.
(9) General Information {#09}
=============================
General Information contains a machine overview. By default, it has a tabbed view:
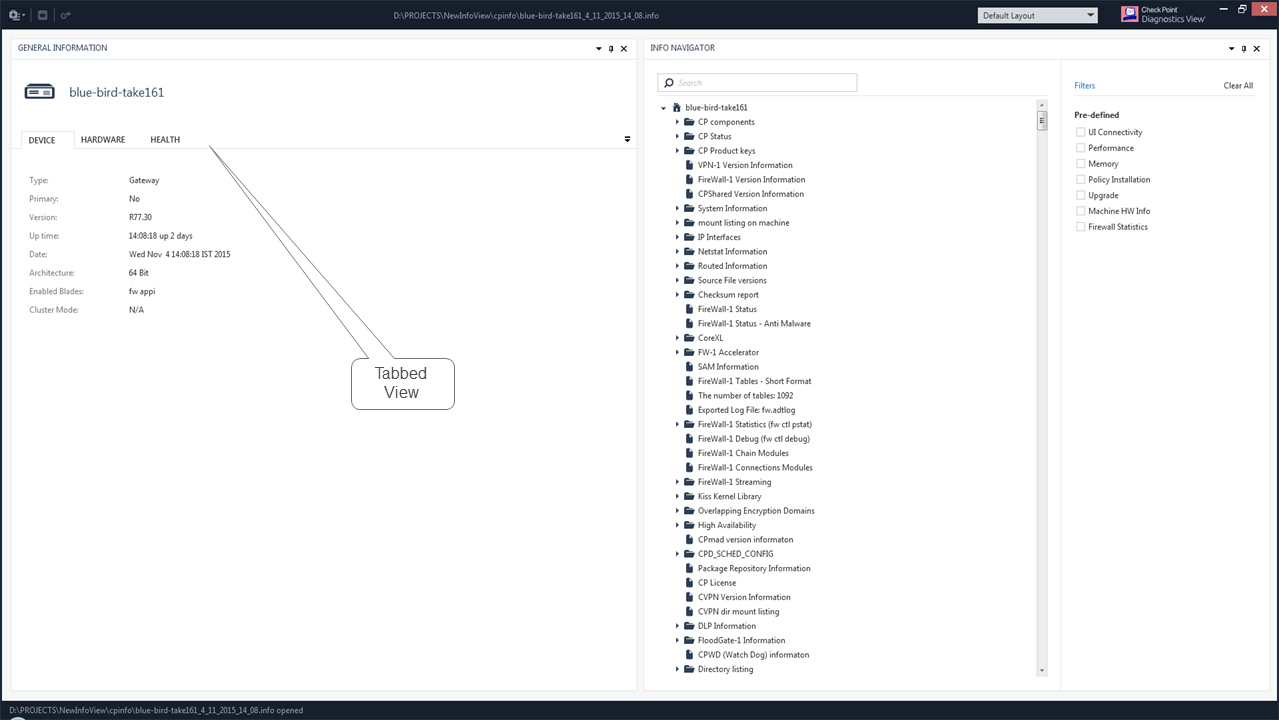
You can drag the tab and change its location:
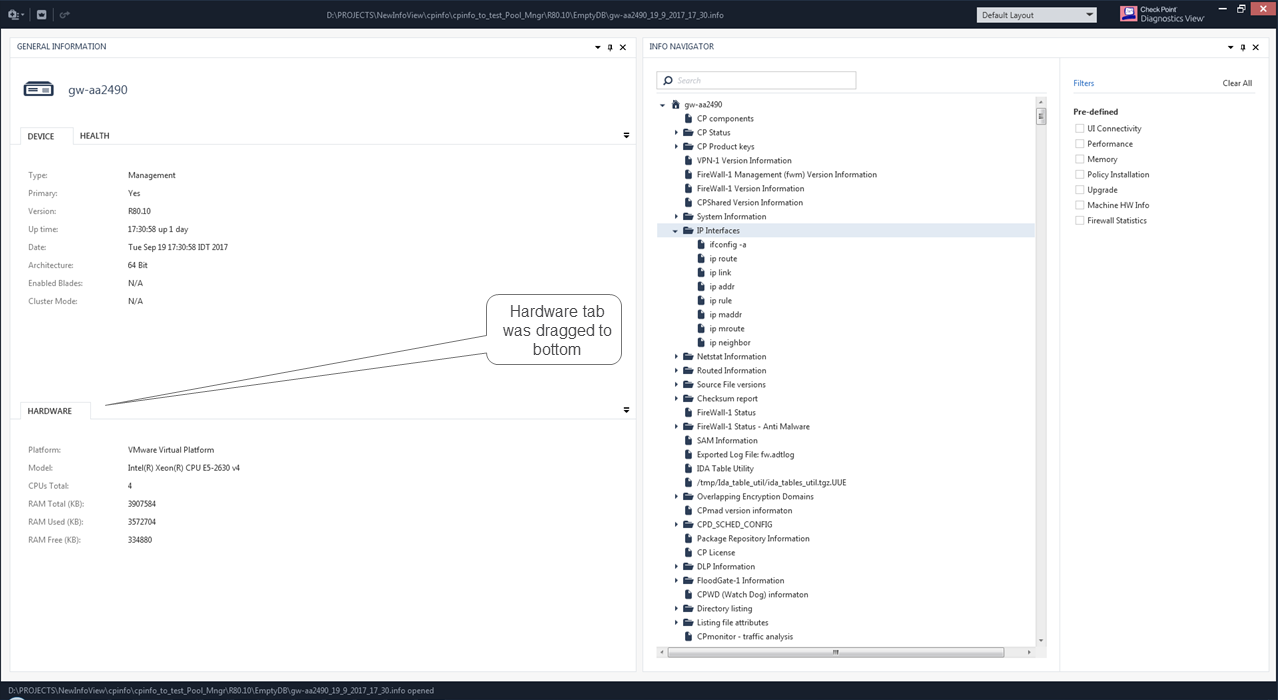
You can configure the General Information tabs and their content for each group in this file:
`C:\Program Files (x86)\CheckPoint\DiagnosticsView\Config\GeneralInfo.xml`
Example:
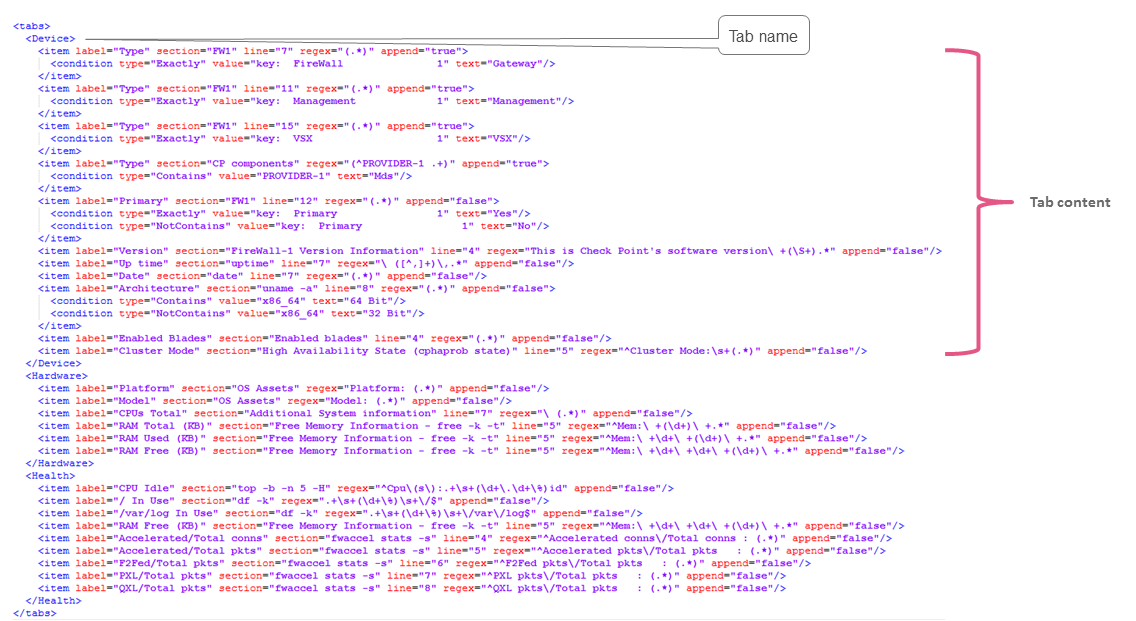
The tab content is defined by the `item` elements.
An `item` element has these attributes:
* **label** - Title that will be displayed in the tab
* **section** - CPInfo section name that contains title value
* **line** - Section line number that contains title value. This attribute is optional. If line is not specified, then the value will be searched within the whole section. Note: The line number includes the section title.
* **regex** - Regular expression to apply on the section line to find the title value.
* **append** - Set to `false` when the item can have only one value. Otherwise, set to `true`. Example: The `Type` value on the **Device** tab may have several values: Gateway, Management, VSX, MDS. Each value is located in a different location. Therefore, the `Type` item sets the `append` attribute to `true`.
An `item` element may have a condition element that is applied to the RegEx match value. The `condition` element is used when another text should be displayed instead of the match value.
The `condition` element has these attributes:
* **type** - can be `Exactly`, `Contains`, `NotContains`
* **value** - value to check for the specified `type`
* **text** - text to display instead of the RegEx match value when the `condition` is `true`
Examples:
* Apply the regular expression "`(.*)`" in line 7 of the "`date`" section. Display the RegEx match value as the "`Date`" value.
> ```
> -
>
>
> ```
(10) SQLite Viewer {#10}
========================
SQLite Viewer is a built-in viewer of the CPInfo SQLite sections and external SQLite files as CPView history.
**Notes:**
* SQLite tables/views can contain a large number of records. Use LIMIT in your queries to avoid running out of memory.
* If the CPView history file is located in the same folder as the CPinfo file, DiagnosticsView will automatically detect it.
* DiagnosticsView supports the automatic opening of the compressed files (`.gz` and `.tar.gz`).
You can open the SQLite Viewer in these ways:
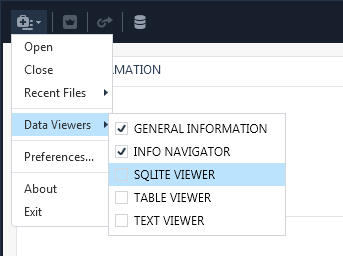
* In the top left corner, click **Menu** \> **Data Viewers** \> **SQLite Viewer**:
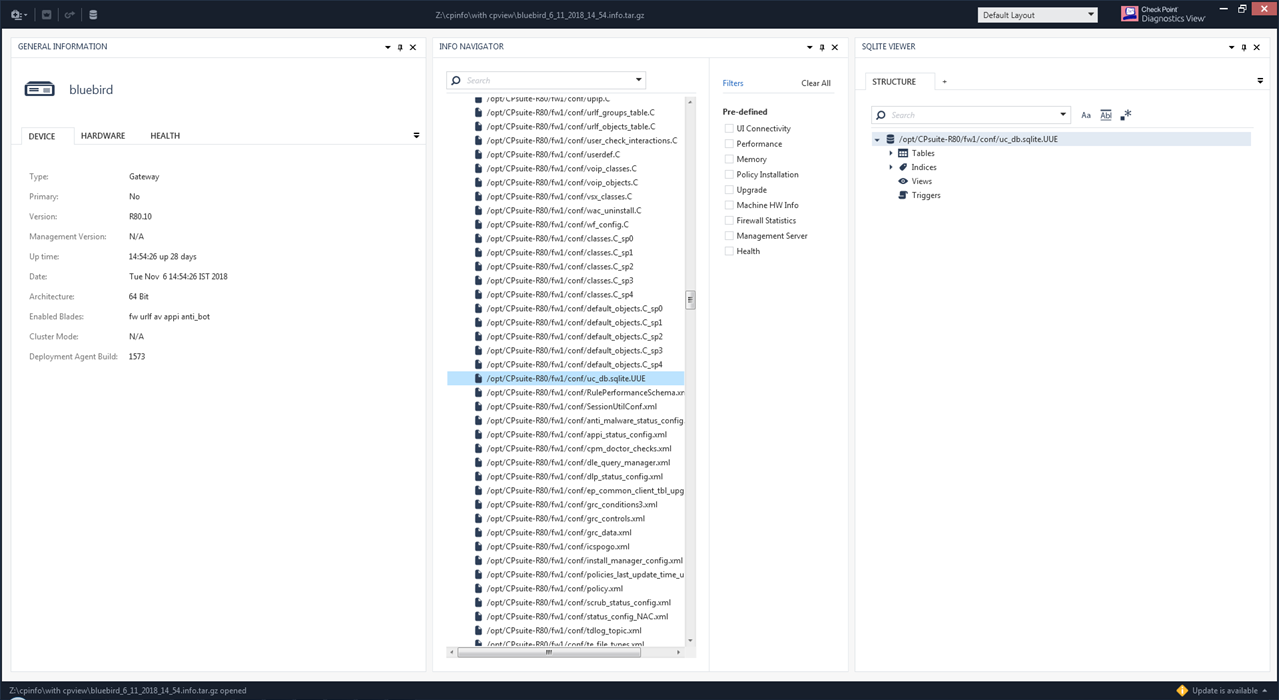
* In the **Info Navigator** panel, double-click the desired SQLite file:
Example:
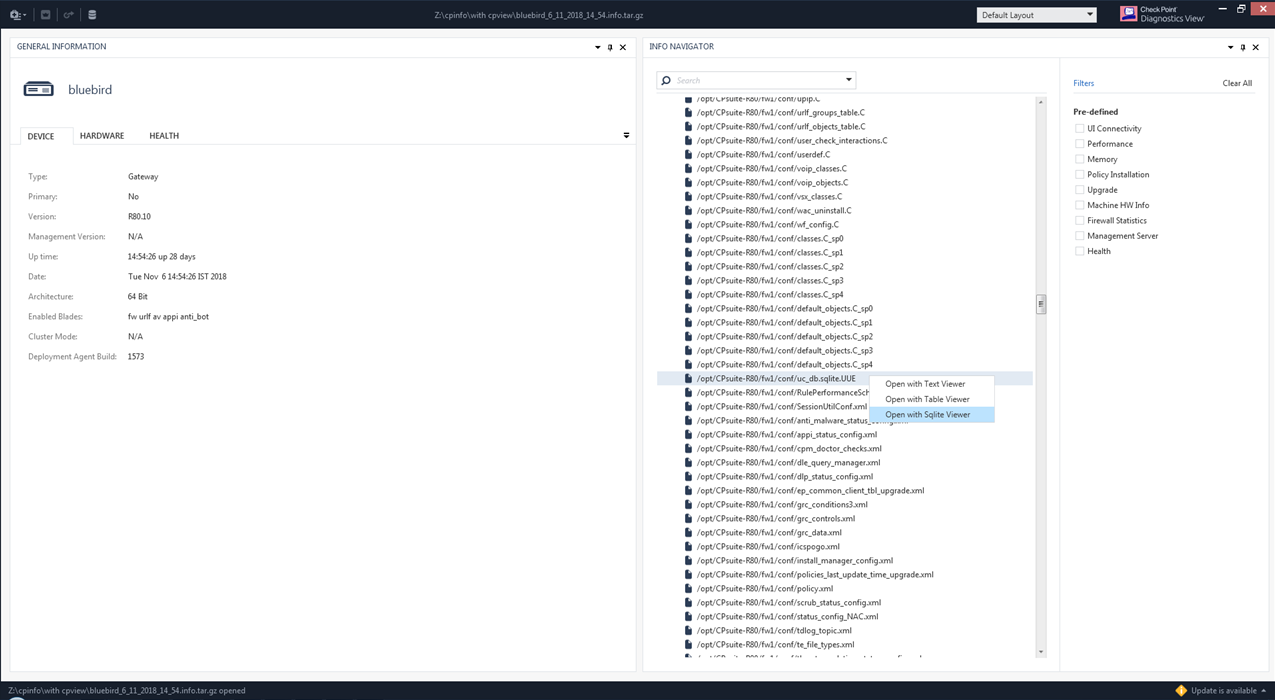
* In the **Info Navigator** panel, right-click the desired SQLite file \> click **Open with SQLite Viewer** :
Example:
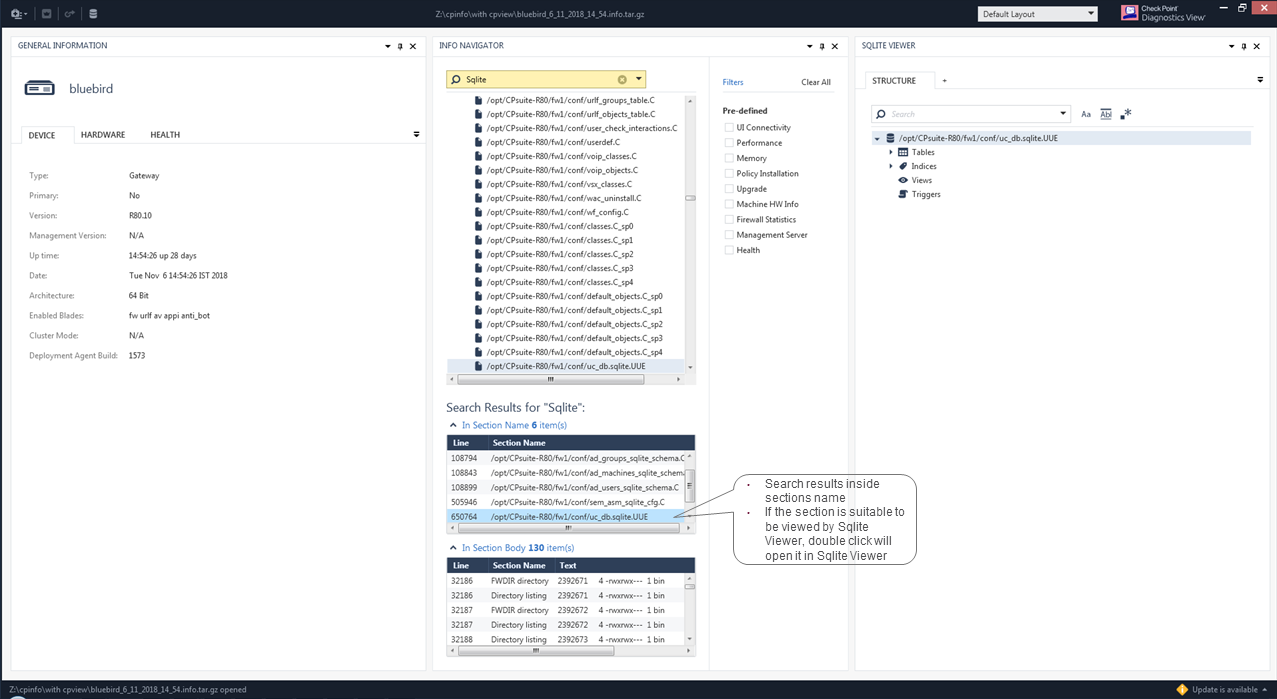
* In the **Info Navigator** panel, search for `sqlite`, and in the **Search Results** section, double-click the desired SQLite file:
Example:
* In the top left corner, click the database icon:
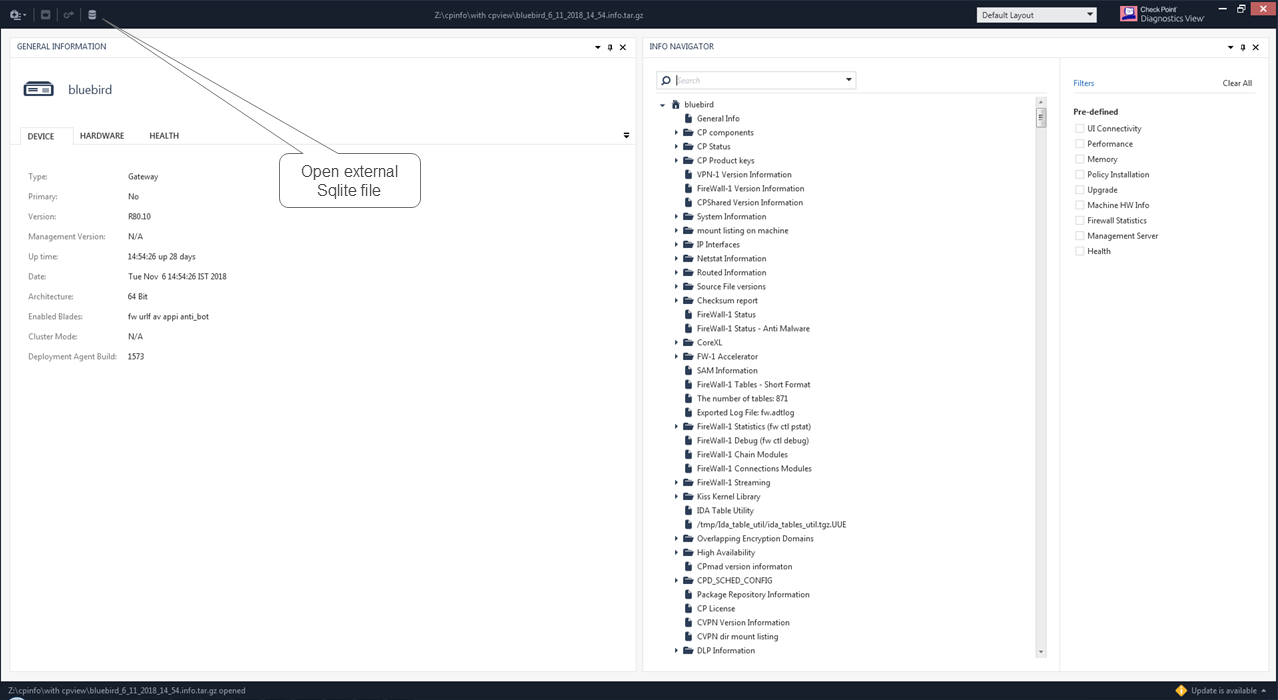
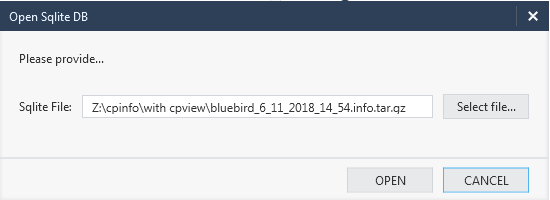
In the **Open Sqlite DB** window, click **Select file** \> browse to the desired SQLite file \> click **Open**.
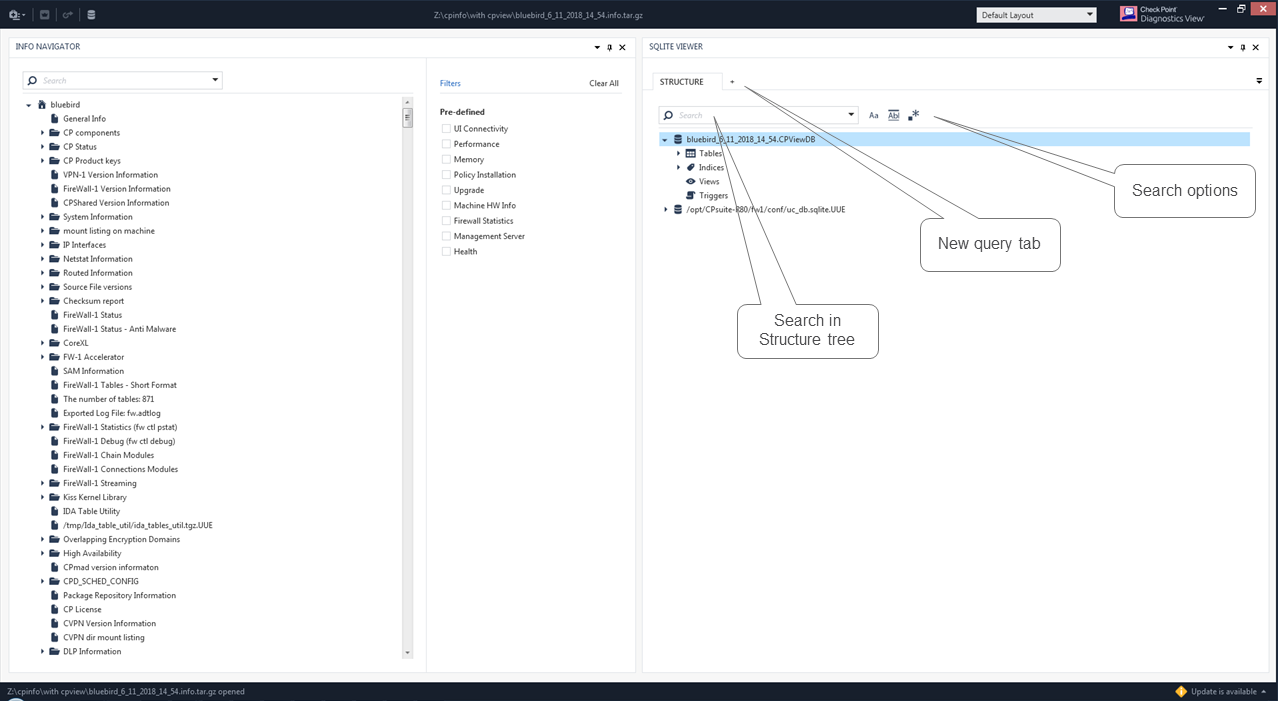
SQLite Viewer consists of the **Structure** and **New Query (+)** tabs.
The **Structure** tab displays the database content (Tables, Indices, Views, Triggers).
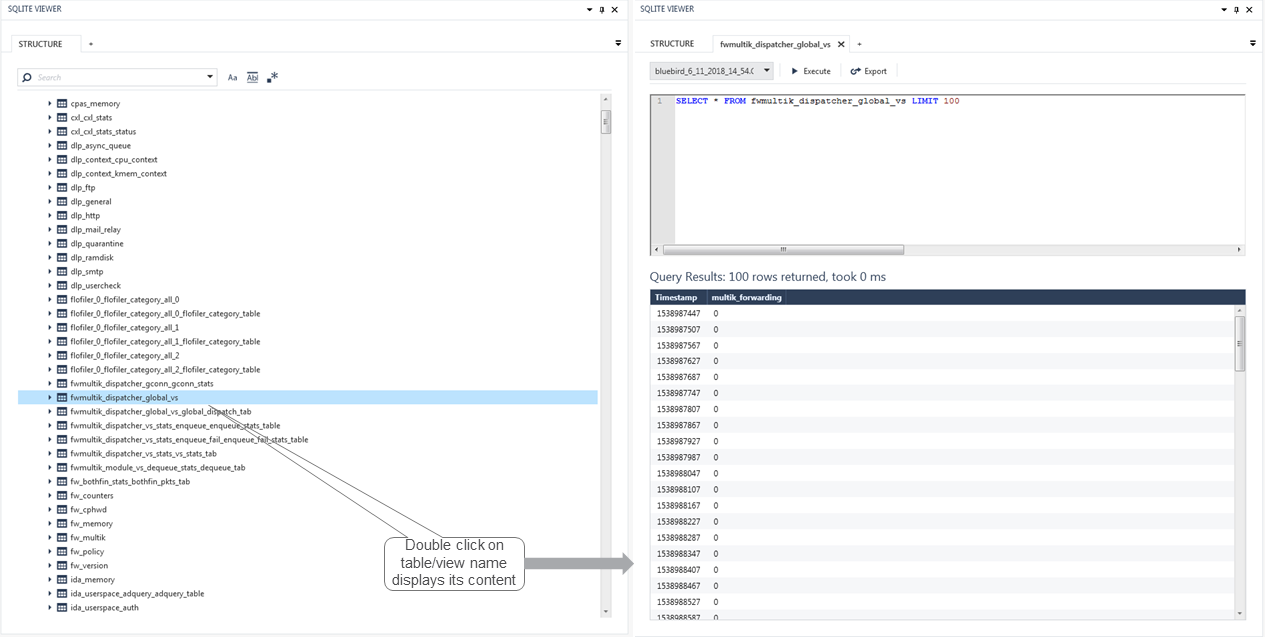
Double-clicking the table/view name in the structure tree will display its content:
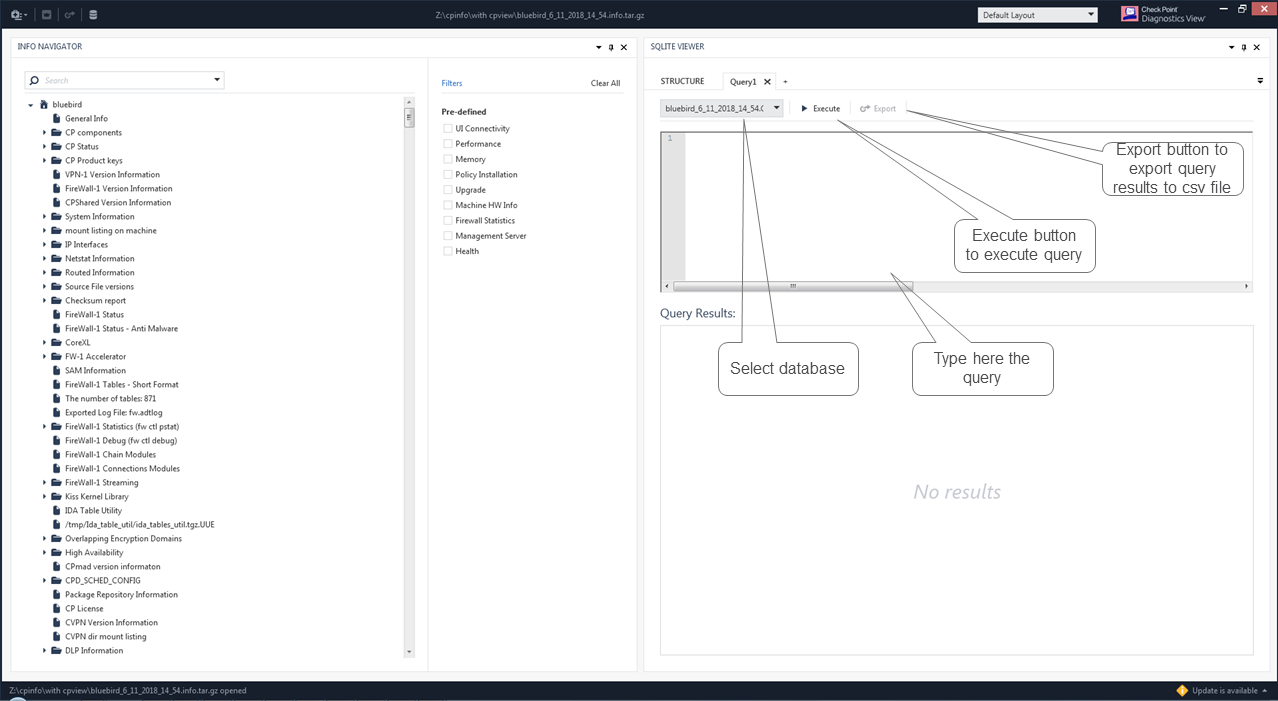
Clicking the '**+**' tab will open the New Query tab:
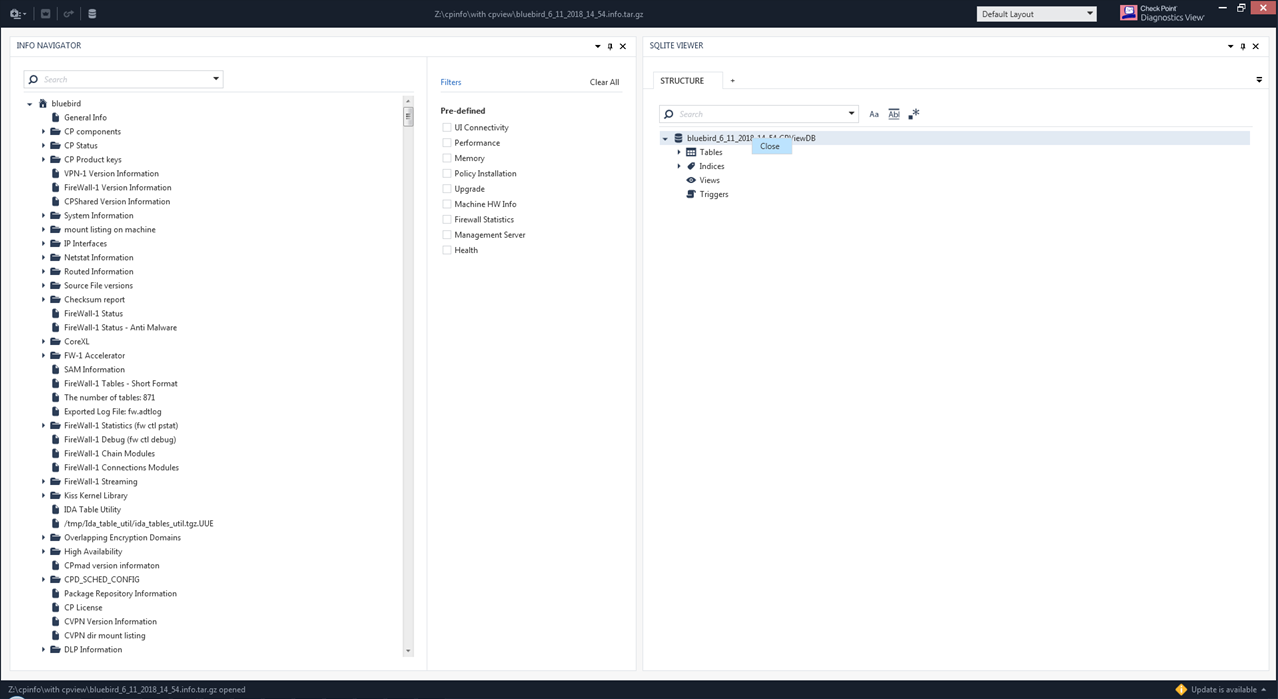
To close the database, right-click the database name in the structure tree and click **Close**:
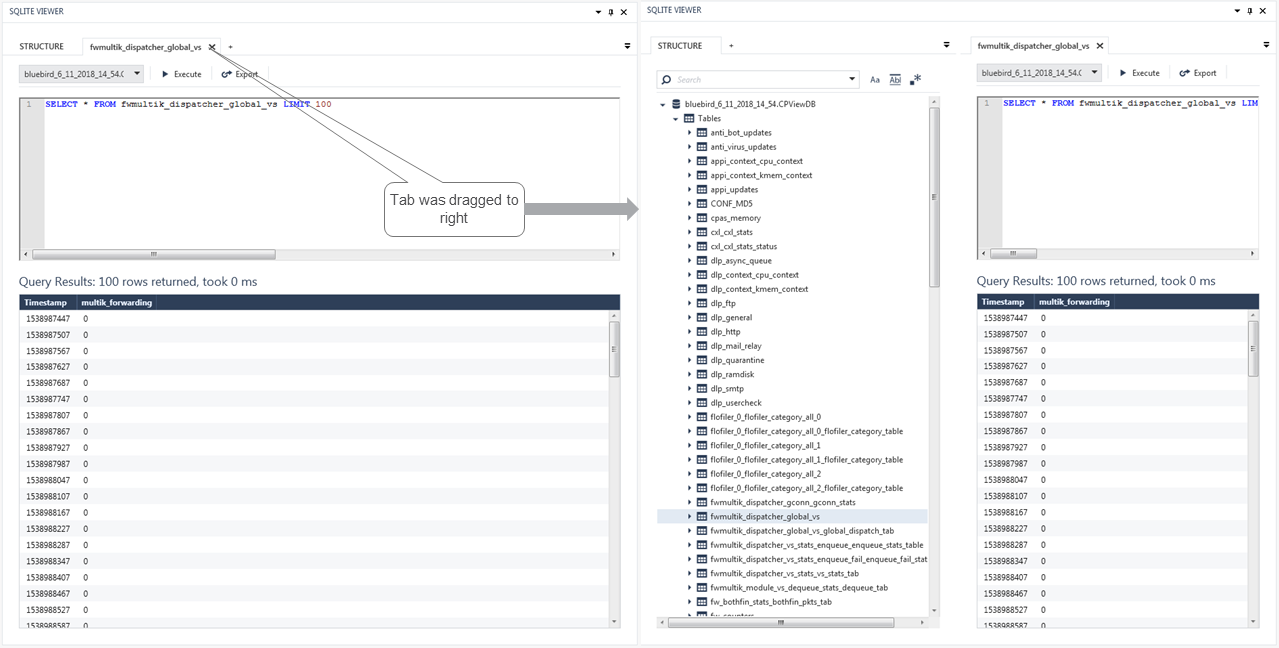
SQLite Viewer tabs can be dragged to different locations:
(11) CPView DB Viewer {#11}
===========================
CPView DB Viewer is a built-in viewer of the CPView history file.
It allows you to define and create a CPView history data chart.
To activate CPView DB Viewer, click the **Database** button located on the top toolbar near the **Menu** button and choose the CPView history file:
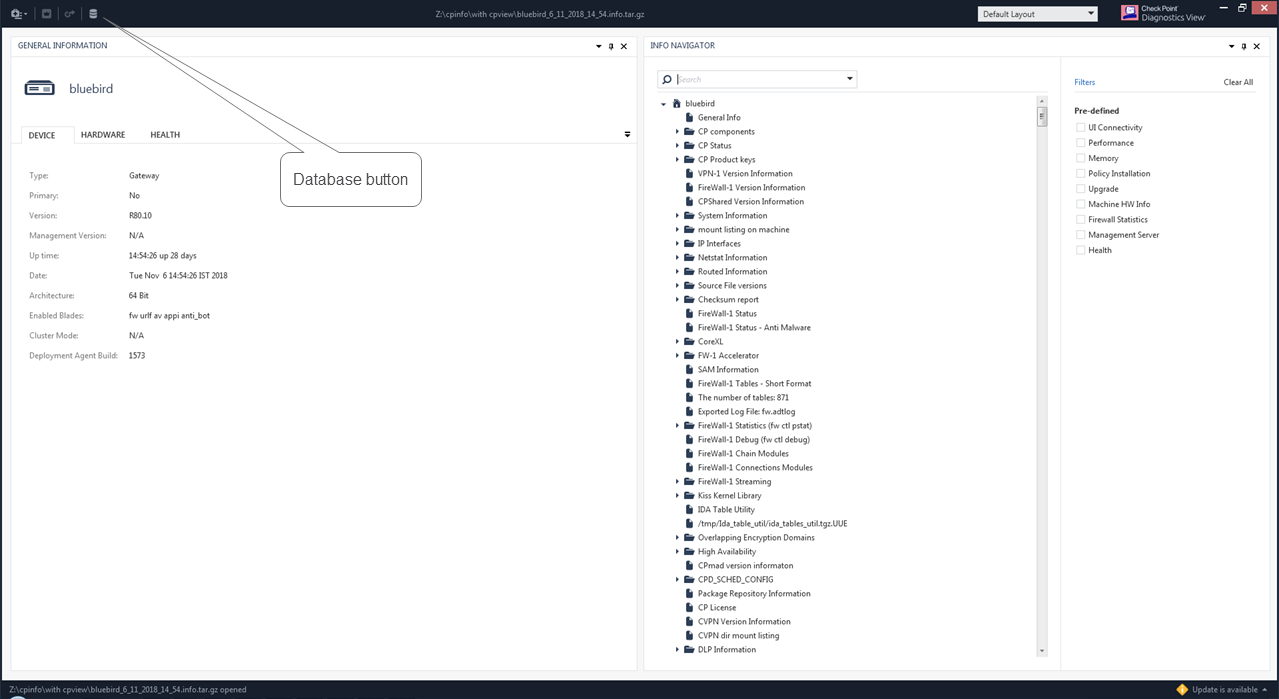
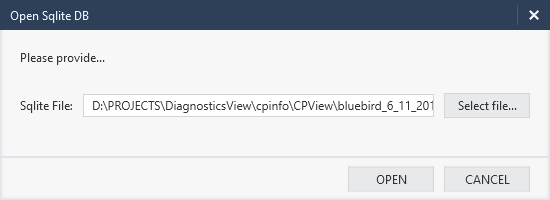
After you click the **Database** button, the **Open Sqlite DB** window will be displayed.
Specify the CPView history file and click the **Open** button:
**Notes:**
* If the CPView history file is located in the same folder as the CPinfo file, DiagnosticsView will automatically detect it.
* DiagnosticsView supports the automatic opening of the compressed files (`.gz` and `.tar.gz`).
Clicking on the **Open** button will activate CPView DB Viewer as a floating panel:
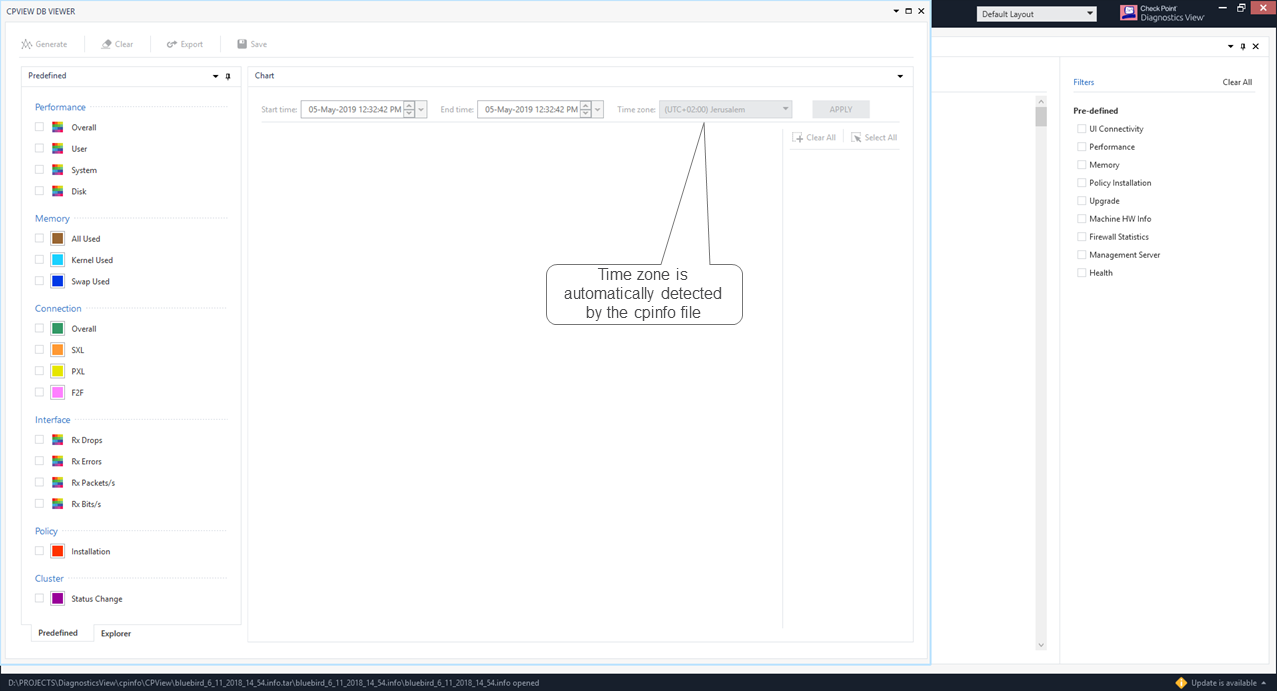
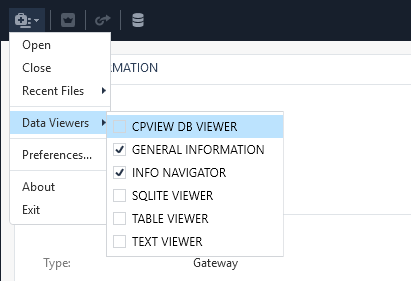
After you close the CPView DB Viewer panel, you can re-activate it in **Menu** \> **Data Viewers**:
(11-A) Series Types {#11-A}
---------------------------
> The chart consists of series. A series is a data set, for example a line graph. CPView DB Viewer supports 3 types of series:
>
> * **Line** - All series points are connected with a line. For example, a used memory line.
> * **Marker** - Series points that have a change on the Y axis value are marked and not connected. For example, blade status (only status changes are marked).
> * **Scatter** - All series points are marked and not connected. For example, policy installation (all policy installations are marked even when the same policy name was installed several times sequentially).
(11-B) Predefined Panel {#11-B}
-------------------------------
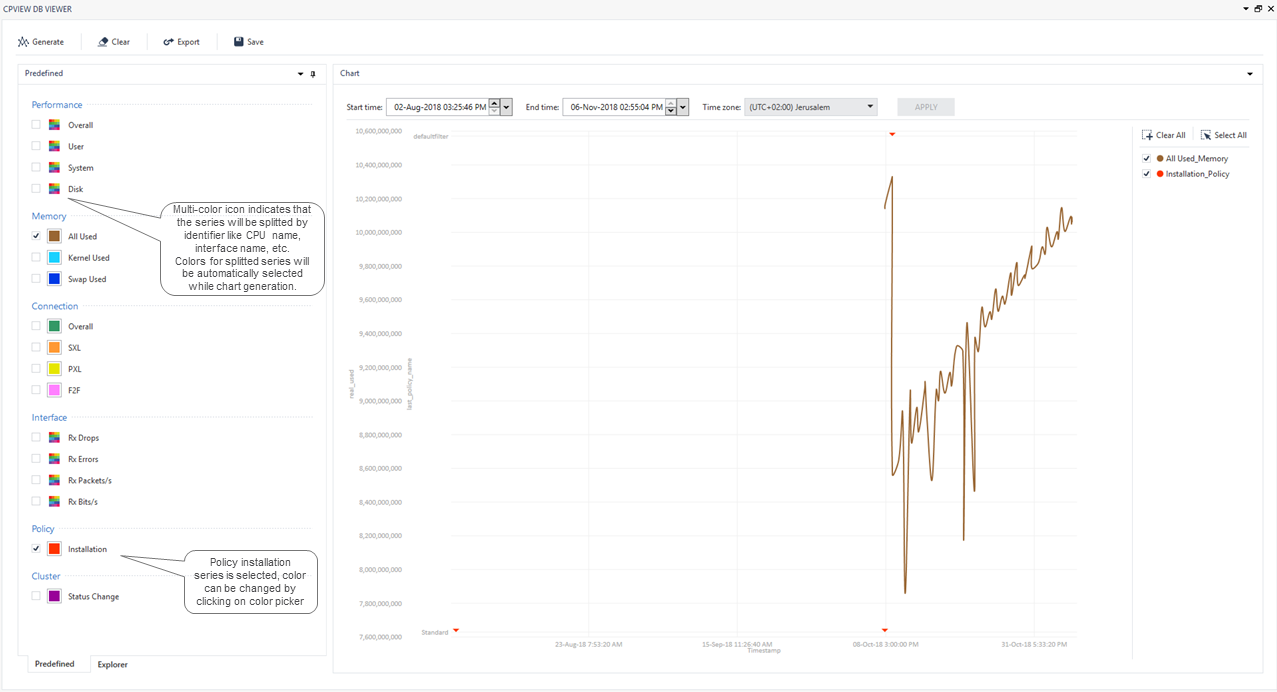
> The predefined panel consists of a list of predefined categories (e.g., Performance, Memory) with predefined series under each category.
>
> 
>
> The predefined panel content is completely configurable in an XML file, and thus can be adjusted for each group:
>
> 1. Create this file:
>
> `C:\Users\%UserName%\AppData\Local\DiagnosticsView\Config\CPViewDbPredefined.user.xml`
> 2. Edit the `CPViewDbPredefined.user.xml` file in advanced text editor (like Notepad++).
>
> 3. Add your predefined categories and series.
>
> **Note:** You can see the predefined configuration in the `Categories.xml` file (typically located in `C:\Program Files (x86)\CheckPoint\DiagnosticsView\Config\CPViewDbPredefined.xml`).
> 4. Save the changes in the file and close it.
>
> Example file:
>
> ```
>
>
>
>
>
>
>
>
>
> ```
>
> A `category` element has these attributes:
>
> * **name** - category name that will be displayed in the **Predefined** tab.
>
> A `series` element has these attributes:
>
> * **name** - series name that will be displayed in the **Predefined** tab.
> * **table** - CPView history table name that contains this series data.
> * **axis_x** - table column name that is assigned to the X axis.
> * **axis_y** - table column name that is assigned to the Y axis.
> * **identifier** - table column name; the series will be split by this column's values (e.g., CPU names, interface names). It os an optional attribute.
> * **type** - series type, can be Line/Marker/Scatter (for more details, refer to the "Series Types" section).
> * **color_r** - R color of the series, optional attribute.
> * **color_g** - G color of the series, optional attribute.
> * **color_b** - B color of the series, optional attribute.
>
> **Note:** If the same category contains several series with the same name, the first series whose table and columns are present in the opened CPView history file will be added.
(11-C) Explorer Panel {#11-C}
-----------------------------
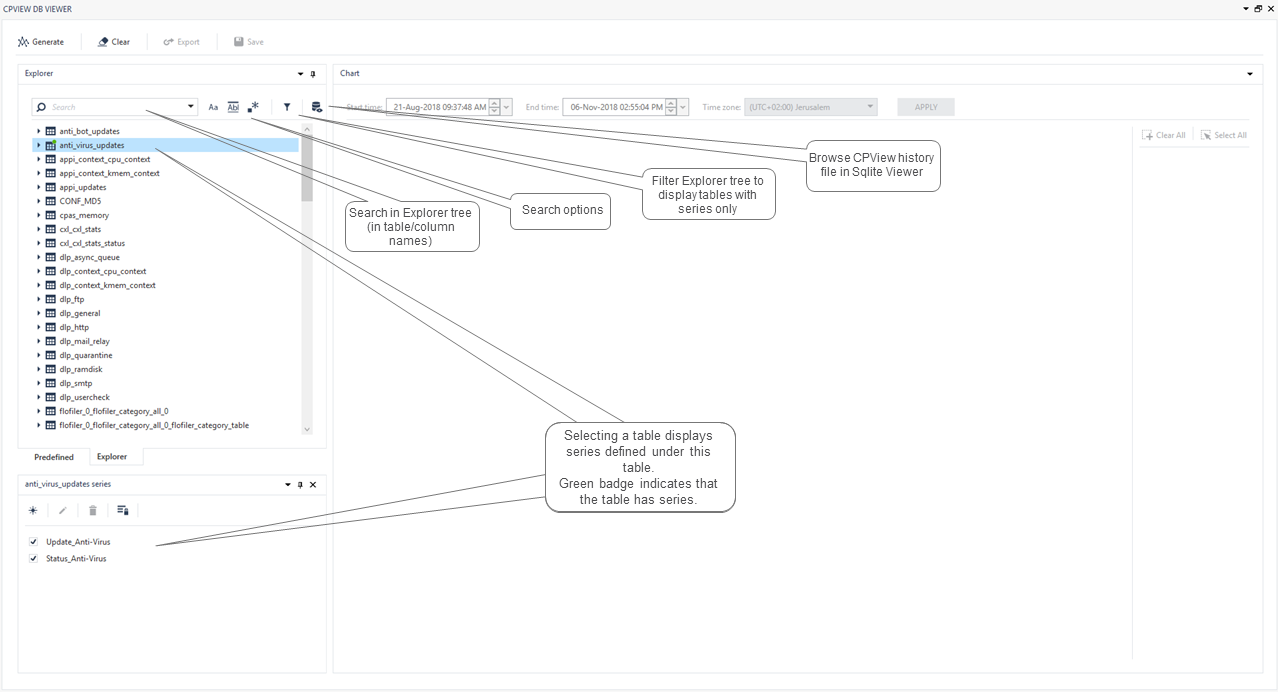
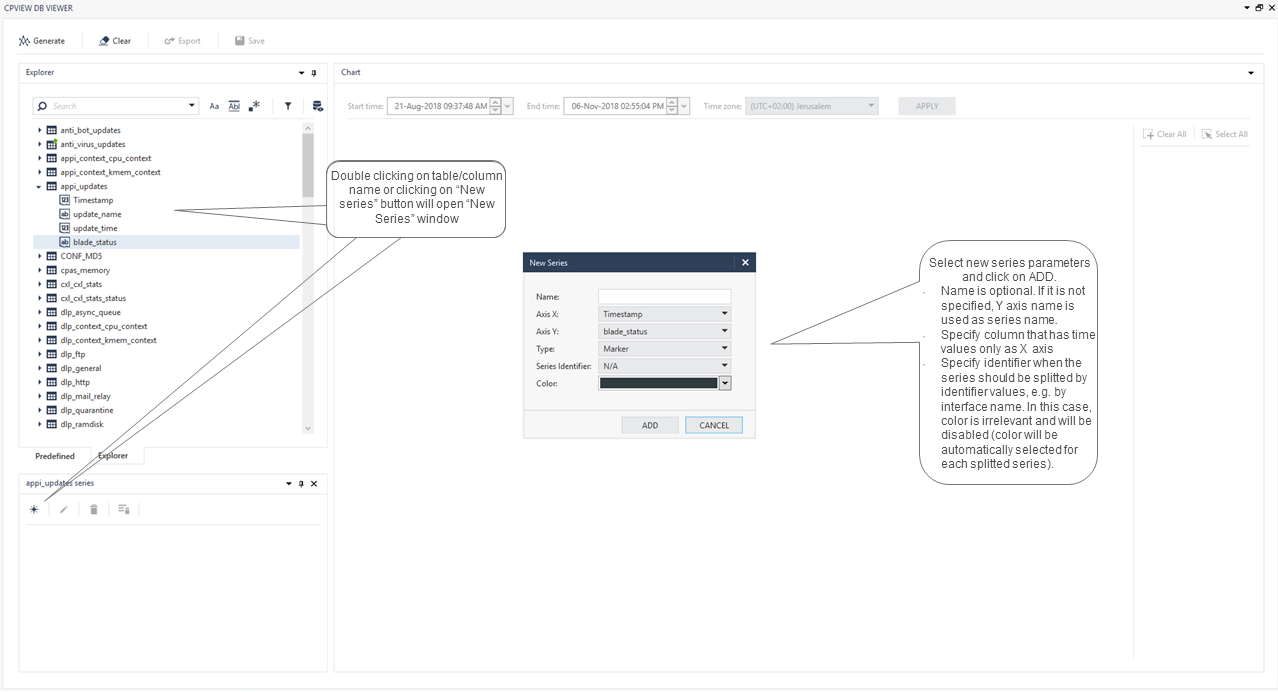
> Explorer Panel is for advanced users. It displays database content (Tables, Views) and enables users to define series under each table.
>
> Selecting any table in the explorer will display an additional panel at the bottom left section that will list all the series defined under the selected table.
>
> 
>
> New series can be defined by:
>
> * Double-clicking the table name
> (default X axis - Timestamp column, default Y axis - first table column)
> * Double-clicking the column name
> (default X axis - Timestamp column, default Y axis - selected column)
> * Clicking on **New series** button in the left bottom table series panel
>
> 
>
> New added series will be selected by default if the selected series count has not reached the maximum. Only selected series will be displayed on the chart.
>
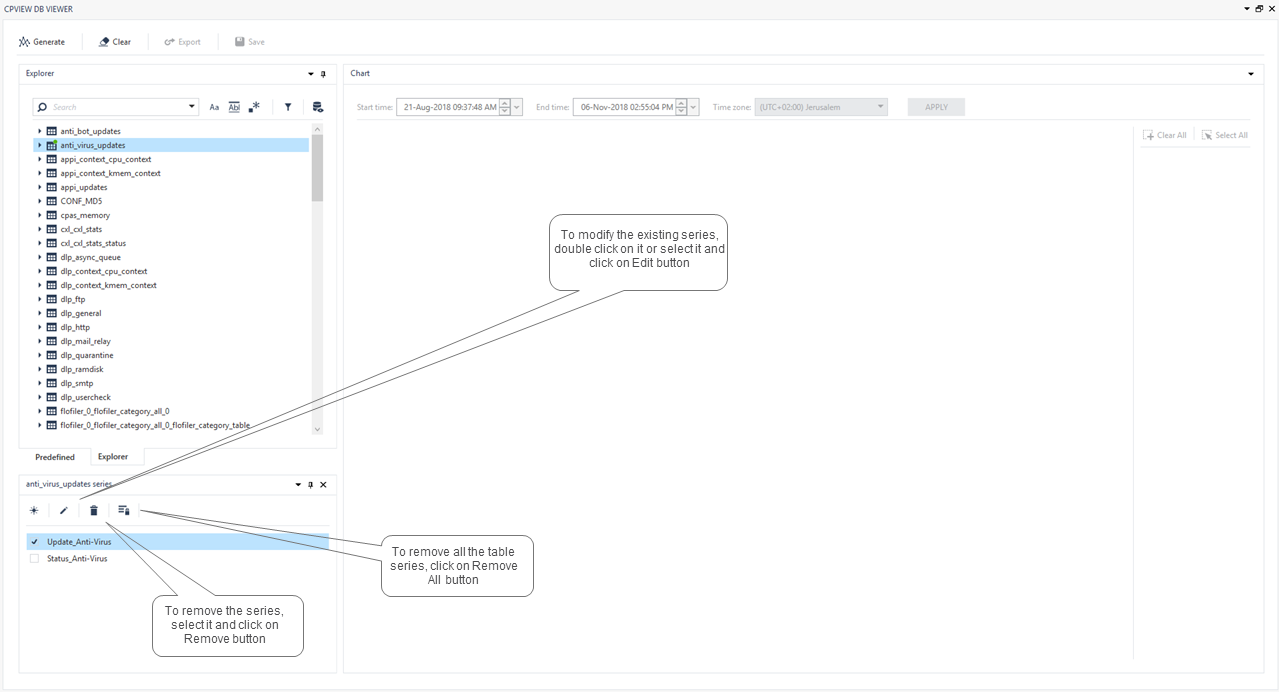
> To modify the existing series, select the table that has the series.
>
> The table's series panel will be displayed on the left bottom side.
>
> Double-clicking on the series name or selecting the series and pressing the **Edit** button will open the **New Series** window with current series parameters.
>
> Modify the required parameters and click the **Add** button.
>
> 
(11-D) Chart Creation {#11-D}
-----------------------------
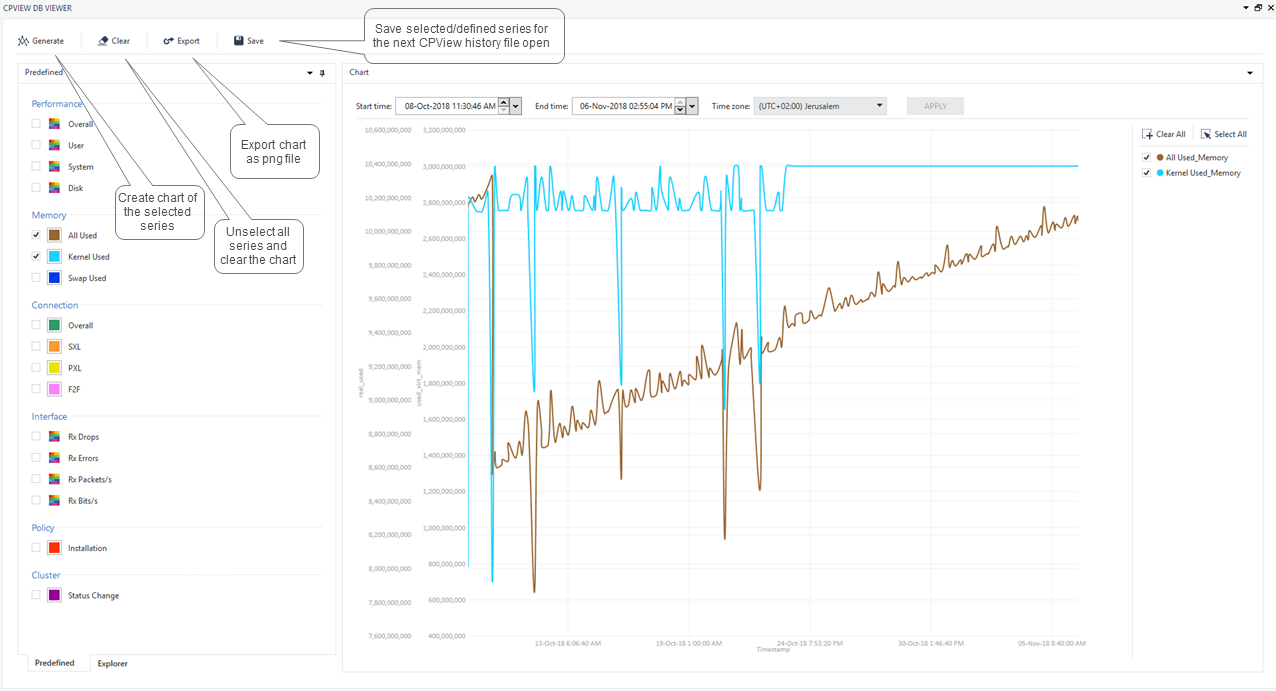
> Select the required series in Predefined/Explorer panel and press the **Generate** button to create the chart.
>
> For each selected series, the separate Y axis will be defined. X axis is always the timestamp.
>
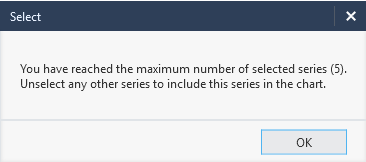
> Only selected series will be displayed on the chart. There is a maximum number of series in the chart.
>
> When you reach the maximum number of the selected series, the following message is displayed:
>
> 
>
> 
>
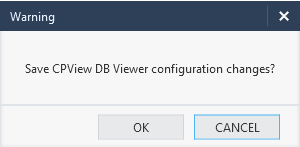
> When the CPView history file is closed and there are unsaved changes (series selection, series deselection, series creation, series removal, series modification), this message appears:
>
> 
(11-E) Chart Panel {#11-E}
--------------------------
> The Chart Panel displays the chart of the selected series.
>
> Use the mouse wheel to zoom in / zoom out.
>
> Click, hold, and drag for panning.
>
> 
(12) Auto-Update {#12}
======================
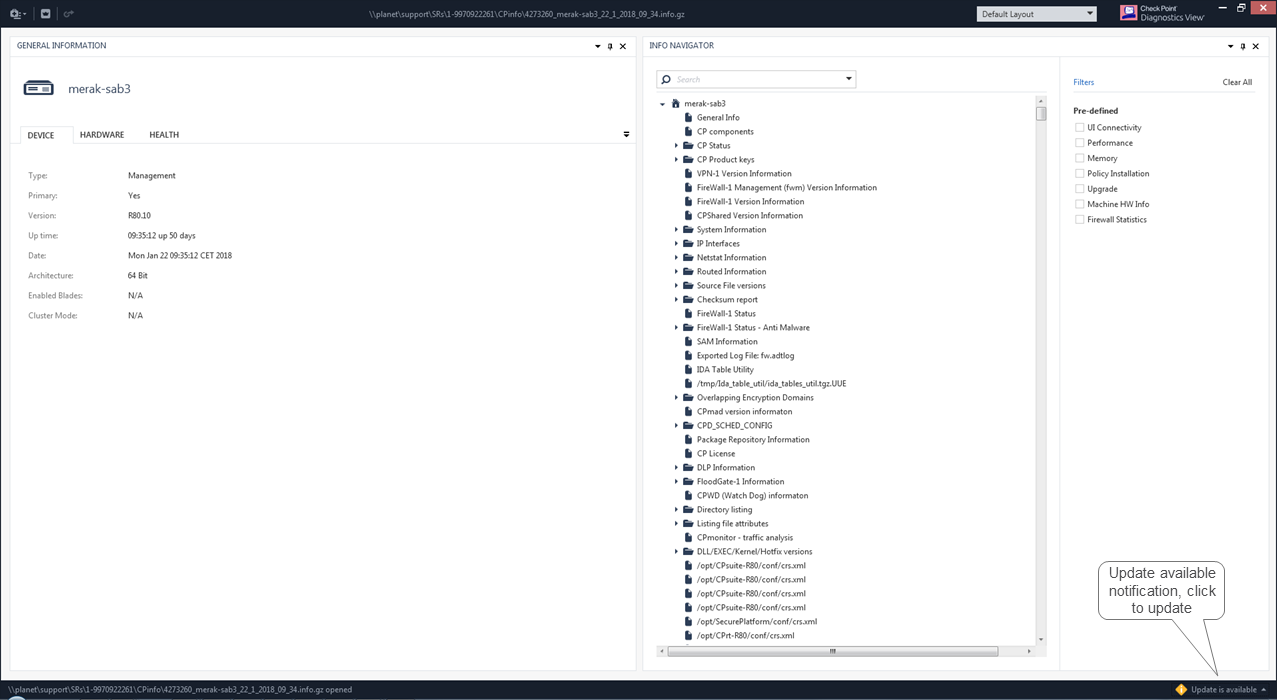
1. DiagnosticsView automatically detects if a new version is available and provides a notification on the bottom-right side of the application window:
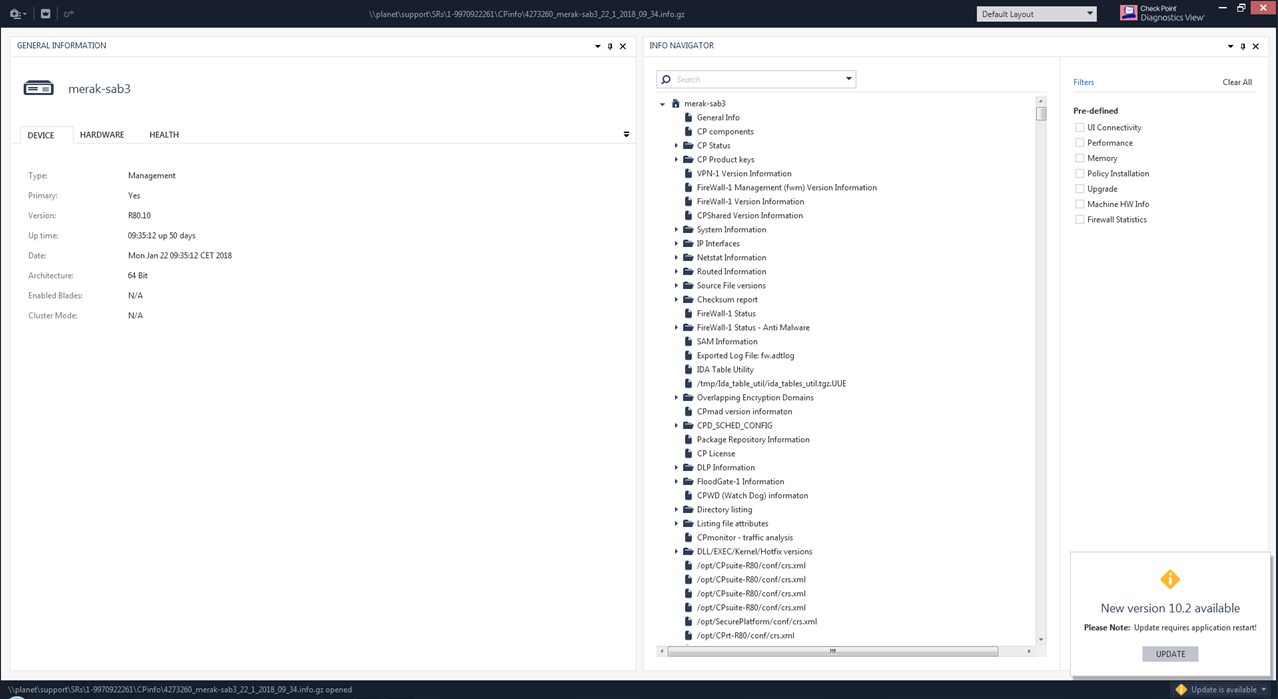
2. Clicking on the update notification will show the available version:
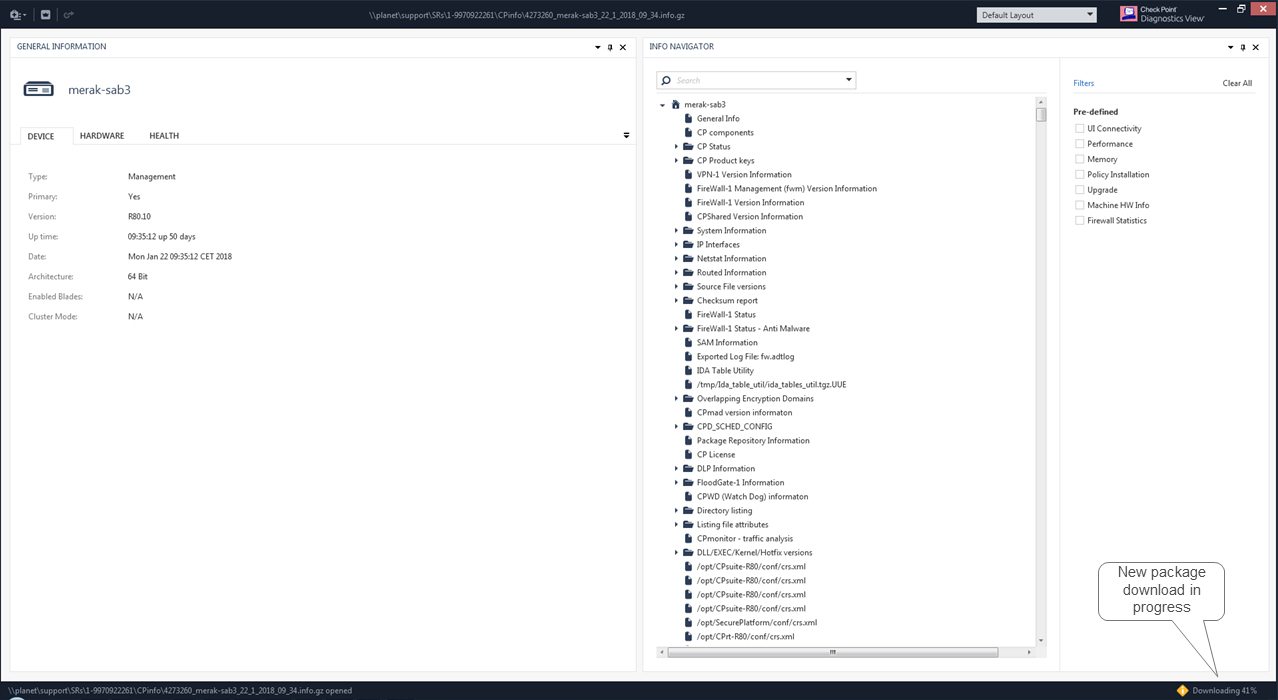
3. Clicking the **Update** button will start a new package download:
4. When the new package download is completed, this message appears for the installation approval:
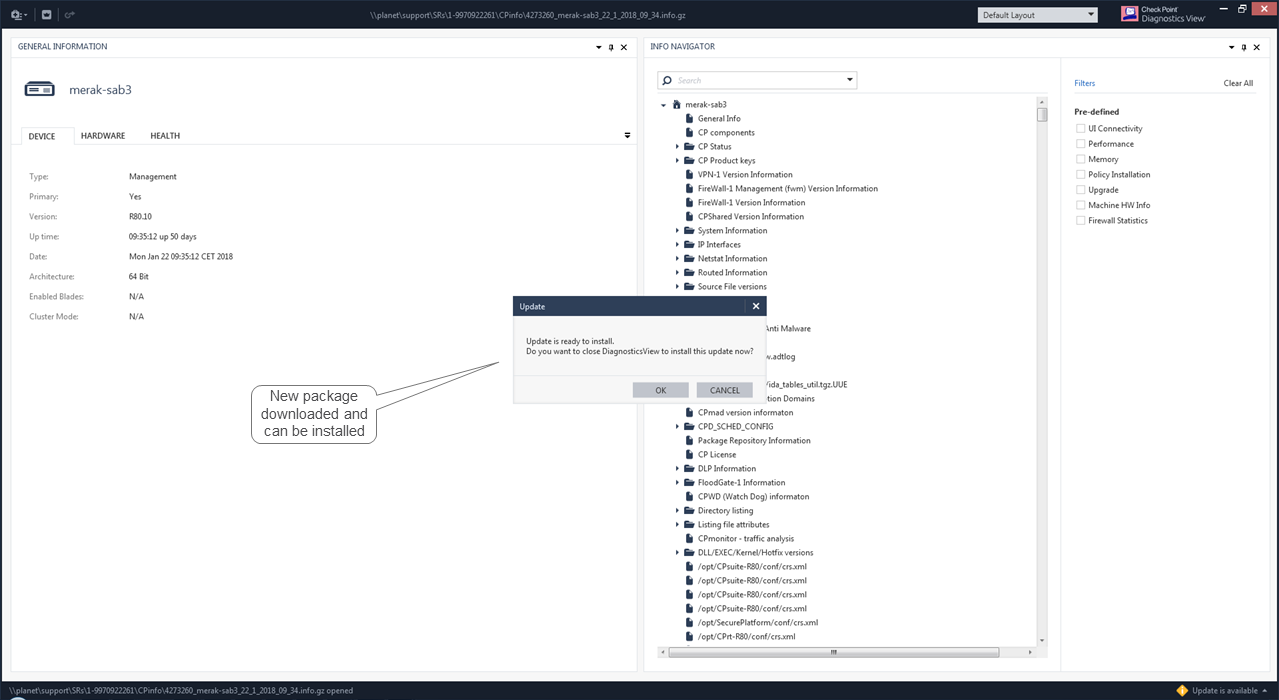
* Clicking the **OK** button will close DiagnosticsView and launch a new package installation wizard.
* Clicking the **Cancel** button will stop the auto-update process. When this happens, you will be able to install the new package on application exit:
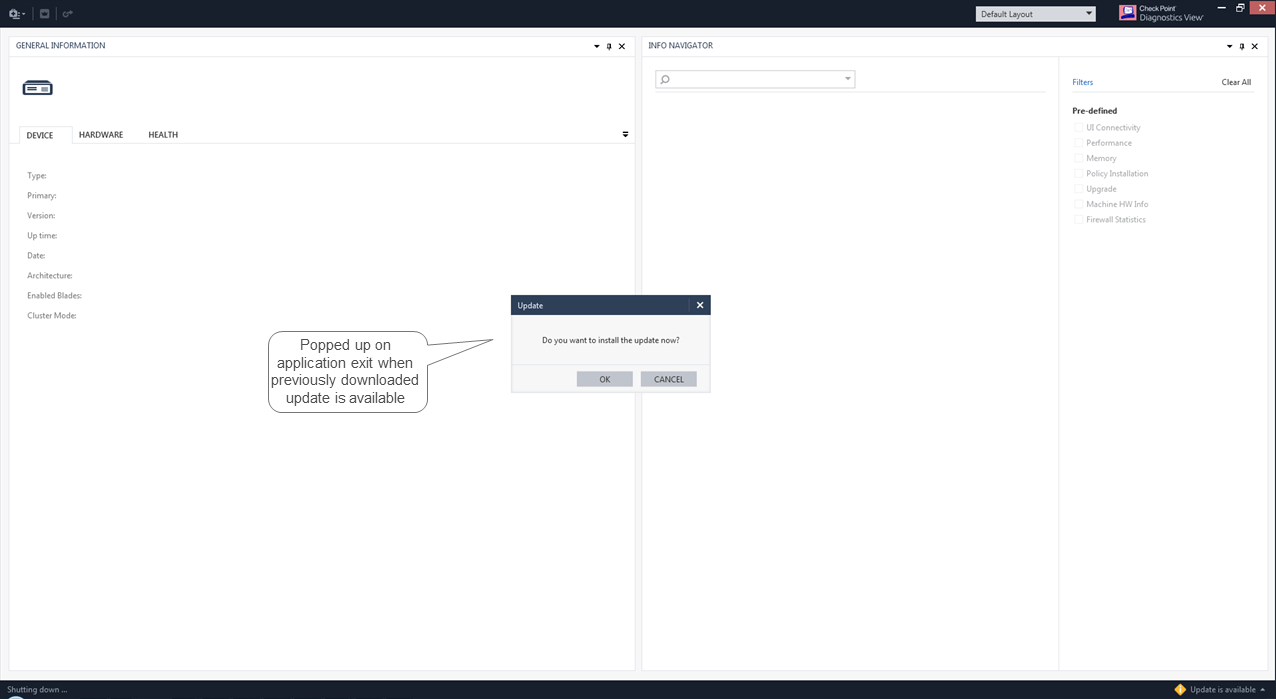
**Note:** After a new package installation, DiagnosticsView is not launched automatically.
(13) About {#13}
================
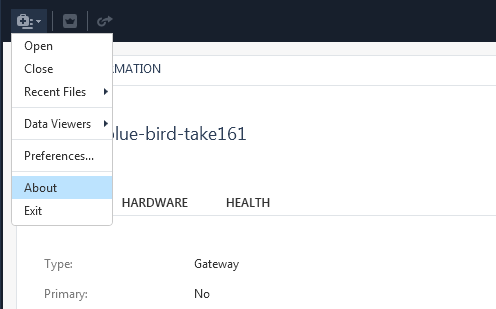
Click the **menu icon** -\> **About** to see the DiagnosticsView application and API versions:
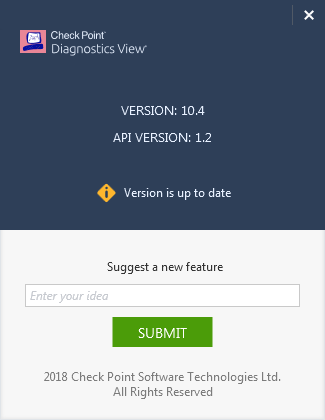
To suggest a new feature, enter your suggestion and click the **Submit** button.
This will send an email to: [diagnostics_view_features_box@checkpoint.com](mailto:diagnostics_view_features_box@checkpoint.com)
(14) Known Limitations {#14}
============================
* When dragging a panel over General Information or Text Viewer panels, two dock placeholders are displayed instead of one. Use the placeholder with the arrows inside:

(15) Troubleshooting DiagnosticsView {#15}
==========================================
Issue #1 - "`Failed to get database content`" error when opening a CPview History database file.
> Show / Hide this section
> Symptom:
> > "`Failed to get database content`" error when opening a CPview History database file.
>
> Cause:
> > Corruption in the DiagnosticsView configuration XML file.
>
> Next Step:
> > 1. Close DiagnosticsView.
> >
> > 2. Go to the `%LocalAppData%\DiagnosticsView\Config\` folder.
> >
> > 3. Rename the file from `CPViewDbConfiguration.user.xml` to `CPViewDbConfiguration__CORRUPTED.user.xml`
> >
> > 4. Open DiagnosticsView.
> >
> > 5. Open the CPview History database file.
> >
> > 1. Click the **Database** button on the top toolbar (near the **Menu**button).
> > 2. Select the **CPView history file** in the **Open Sqlite** **DB** window.
> > 3. Click **Open**to load the database.
> > 6. Close DiagnosticsView.
> >
> > 7. Create a new `CPViewDbConfiguration.user.xml` file.
> >
> > 8. In the new file, configure the required parameters from the corrupted file.
> >
> > 1. Locate both files.
> > * Corrupted file:
> > `%LocalAppData%\DiagnosticsView\Config\CPViewDbConfiguration__CORRUPTED.user.xml`
> > * New file:
> > `%LocalAppData%\DiagnosticsView\Config\CPViewDbConfiguration.user.xml`
> > 2. Use a text editor (such as Notepad++, Visual Studio Code, or Notepad) to open both XML files side by side.
> > 3. Look for any custom settings, paths, or configuration values in the corrupted file that are not present in the new file. Typical parameters might include:
> > * Database file paths
> > * User preferences (examples: view settings, filters)
> > * Connection settings
> > 4. Manually copy the relevant XML elements or values from the corrupted file to the new file. Do not copy the entire file---only the specific settings you need.
> > 5. After copying the required parameters, save the new `CPViewDbConfiguration.user.xml`.
> > 9. Open DiagnosticsView.
> >
> > 10. Open the CPview History database file.
(16) Release Notes {#16}
========================
|-------------------------------------------------------------------------------------------------------------------------------------------------------------------------------------------------------------------------------------------------------------------------------------------------------------------------------------------------------------------------------------------------------------------------------------------------------------------------------------------------------------------------------------------------------------------------------------------------------------------------------------------------------------------------------------------------------------------------------------------------------------------------------------------------------------------------------------------------------------------------------------------------------------------------------------------------------------------------------------------------------------------------------------------------------------|
| Version 10.11 |
| * CPView DB enums now appears as a real string on the CPView DB Viewer * Logo changed to the new Check Point logo * Text Viewer font changed to Courier New font for better display of ASCII tables * CPView Table Viewer * changed line separators to prevent the combination of tables in sections like "CP monitor - traffic analysis" * Fixed an issue in the Table Viewer config file to show the last column of the "top -b -n 5 -H" section * Table Viewer no longer opens by default * Upgraded Renci.SshNet.dll. Policy View can connect R80.40 machines with newer OpenSSH. * Disabled DB file button when policy view is in progress |
| Version 10.10 |
| * Enabled CPView database file open without CPInfo file * CPView DB Viewer * Added scroll bar to the legend * Added database file name to the title * Fixed an issue in which the app suddenly closes if a chart is generated when a big database is opened * Added chart smoothness enable/disable option * Pop-up message when there is no data to display * Preserved user selected start/end time for the next chart generation * Changed data presentation for better big database handling: * Initially, the generated chart displayed only one day back. * Added chart data auto load option when moving out of start/end range by panning or zooming * Improved message box appearance for better error/warning/info indication * Added new cpinfo sections "show version all" and "show sysenv all" to "Machine HW Info" and "Health" filters * Added a pop-up message (in addition to the status bar message) when CPInfo file fails to open. |
| Version 10.9 |
| * New CPView DB Viewer (enables creation of CPView history file data chart) * SQLite Viewer * Fixed sudden program close when closing Query tab * Info Navigator * Fixed sudden program close when Double-clicking an item in Info Navigator. * Table Viewer * Fixed "CP License" section appearance. * Fixed "Directory listing" section detection as table section.Info NavigatorFixed sudden program close when Double-clicking an item in Info Navigator. |
| Version 10.5 |
| * New SQLite Viewer for viewing CPInfo Sqlite sections and external Sqlite files like CPView history. * Updated UI elements appearance. * Info Navigator: * Set default "CP Status - OS" section viewer to Table Viewer. * Updated "Machine HW Info" filter with memory sections and "Hard Drive Info" subsections. * Added new 'Health' filter. * Added regex support to SectionDefaults.xml and SectionDefaults.user.xml. * Text Viewer: * Fixed memory release on document close. * Policy View: * Fixed Policy View failure due to cpstart timeout. |
| Version 10.4 |
| * General Information: * Added Deployment Agent Build to Device tab. * Added Management Version to Device tab. * Removed leading spaces (if present) when displaying Platform \& Model in Hardware tab . * Info Navigator: * Added regex support when defining a filter. * Added new "Management Server" filter. * Extended "Upgrade," "Policy Installation," "UI Connectivity," and "Machine HW Info" filters. * Improved navigation tree population time. * Added context menu to search results. * Fixed disabled context menu behavior. * Fixed "Sometimes sections that are not related to the filter are displayed under the filter." * "Hotfix versions" section default viewer changed from Table Viewer to Text Viewer. * Policy View: * Fixed "Fingerprint question during machine preparation." * Fixed "Sometimes "Smart Console failed to startup" message pops up when Smart Console succeeded to startup. * Fixed "SSH messages in the pre-policy view window are messed." * New About window with the possibility to suggest a new feature. |
| Version 10.3 |
| * Table Viewer: New viewer that automatically detects table structures within section data and displays them as user-friendly tables. * Info Navigator: Double clicking on a section within the navigation tree or search results will open the section in the best viewer (Table/Text Viewer).Note: Default viewer can be defined by the configuration file. For more details, refer to "Default sections Data Viewer" section. * Info Navigator: Right clicking on a section in the navigation tree will open a context menu to choose a viewer. * Auto update: DiagnosticsView automatically detects if a new version is available, provides a notification in the right bottom side of the application window, and updates the version if it was approved. * Win 10 support (i.e., log file and layouts are saved in the user folder instead of the installation folder). * Multiple DiagnosticsView instances logging. * New expander appearance. |
---
# Agent Instructions
This content is from the Check Point Support Center (https://support.checkpoint.com), the official knowledge base for Check Point cybersecurity products.
## Navigating This Knowledge Base
- **Complete index**: [llms.txt](https://support.checkpoint.com/llms.txt)
- **All SK articles**: [SecureKnowledge Sitemap](https://support.checkpoint.com/sitemaps/secureknowledge-sitemap-index.xml)
- **SK article URL pattern**: `https://support.checkpoint.com/results/sk/{skId}`
- **Markdown responses**: AI bot User-Agents automatically receive `text/markdown` content