> Source: [sk108955](https://support.checkpoint.com/results/sk/sk108955)
# sk108955 - ATRG: Capsule Workspace, collect and send logs
| Property | Value |
|----------|-------|
| Solution ID | sk108955 |
| Date Created | 2015-12-03 |
| Last Modified | 2025-03-17 |
| Technical Level | General |
| Products | Endpoint Security |
| Versions | Cloud, E89.X, E88.X |
| OS | Android, iOS |
## Solution
**Table of Contents:**
* Introduction
* Troubleshooting Capsule Workspace
* Gathering User Info and Debug Logs
* Sending Advanced Debug Information
* Understanding the Debug Logs
* Deciphering Capsule Workspace Logs
* Clearing Capsule Persistent Data
* Troubleshooting Common Problems
* Additional Information
Introduction {#Introduction}
----------------------------
Capsule Workspace is a secure container client with SSL VPN capabilities for remote access.
* It supplies secure connectivity and access to web-based corporate resources and Microsoft Exchange services.
* It encrypts the corporate data and protects from data leakage
* It has advanced document sharing control and protection capabilities for documents integrating with Capsule Docs product
* Capsule Workspace is integrated with Check Point SandBlast Mobile and blocks access to the organization resources in case that any type of mobile attack is detected on device.
Capsule Workspace is ideal for mobile workers who have privately-owned smart phones or tablets (BYOD). It protects only the business data inside the App and does not require device-level security measures, such as device-lock or device-wipe.
Capsule Workspace is supported both for iOS and Android mobile devices
Troubleshooting Capsule Workspace {#Troubleshooting Capsule Workspace}
----------------------------------------------------------------------
Capsule Workspace collects extensive logs in order to help debug any possible problem.
In case of a problem, you should request those logs from the user.
### Gathering User Info and Debug Logs {#Gathering User Info and Debug Logs}
First gather as much information as you can from the user about his problem.
In addition check his environment:
* Device model (e.g. Pixel 4, Galaxy S10, iPhone12, etc').
* Device OS Version (e.g. Android 10, Android 7, iOS 14.1, etc').
* Capsule Workspace Version.
* Exchange Server Version (e.g. Exchange 2013, Exchange 2016, office 365 env').
* Mobile Access GW version (R80.40, R81, etc').
Then, ask from the user to send the debug logs from Capsule.
#### Sending Debug Logs from an iOS device {#Sending Debug Logs from an iOS device}
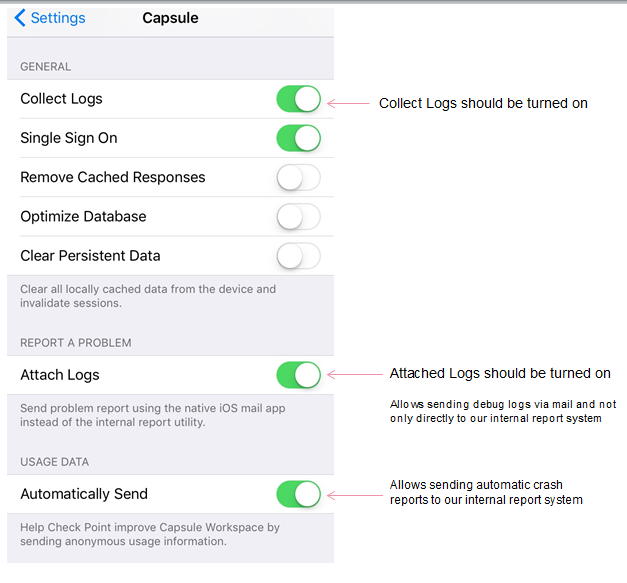
1. First check the debug setting of Capsule. Go to Device's Settings -\> Capsule:
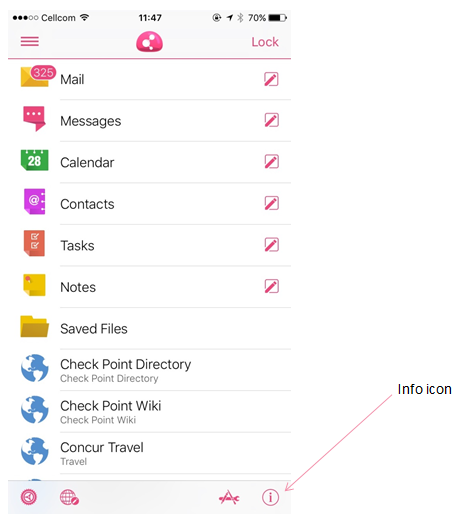
2. In the applications list screen (or from any other screen that has an info icon) tap the info icon:
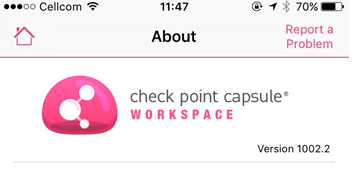
3. The "About" Screen of Capsule Workspace will be opened. In the left corner of the upper toolbar -- select "Report a Problem"
4. The following screen will be opened:

#### Sending Debug Logs from an Android device {#Sending Debug Logs from an Android device}
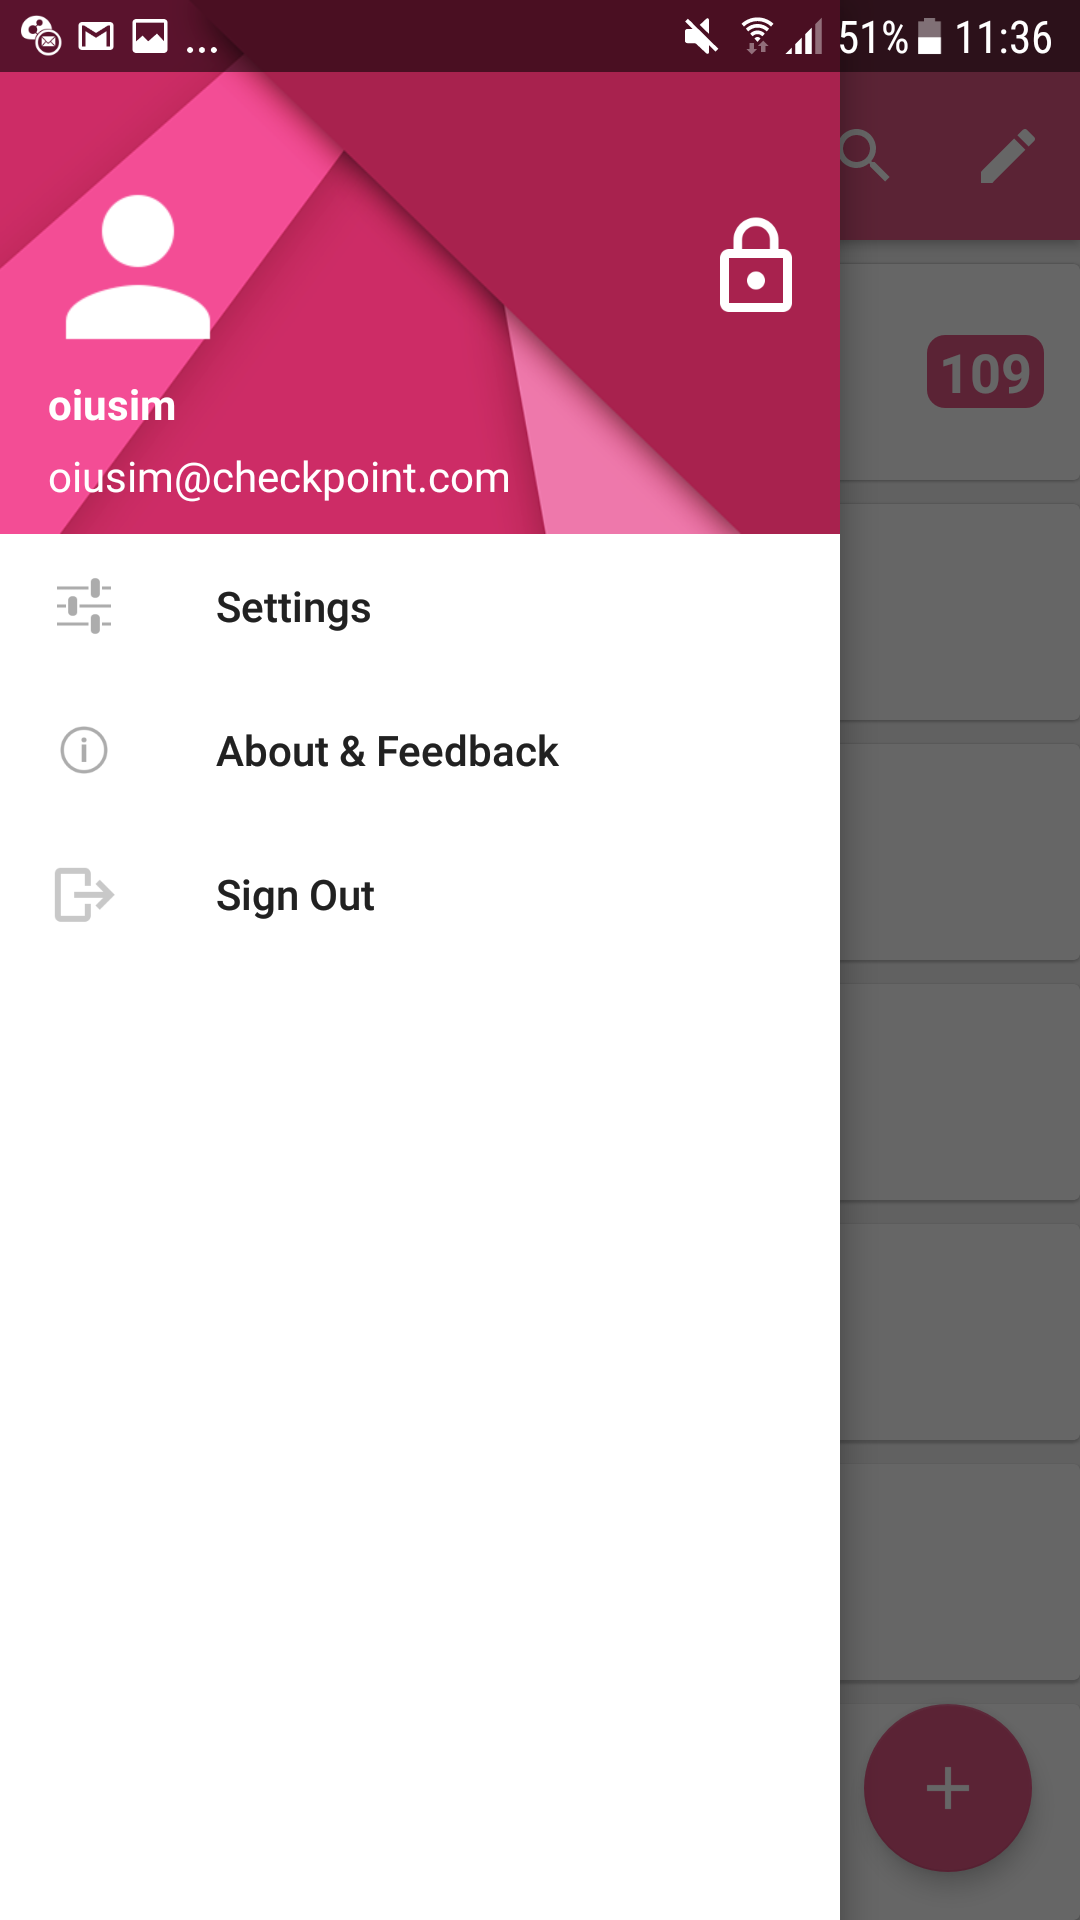
1. Open the left side drawer and select "About \& Feedback"
2. The "About and Feedback" screen will be opened. Tap on "Report a Problem".
3. The following screen will be opened:
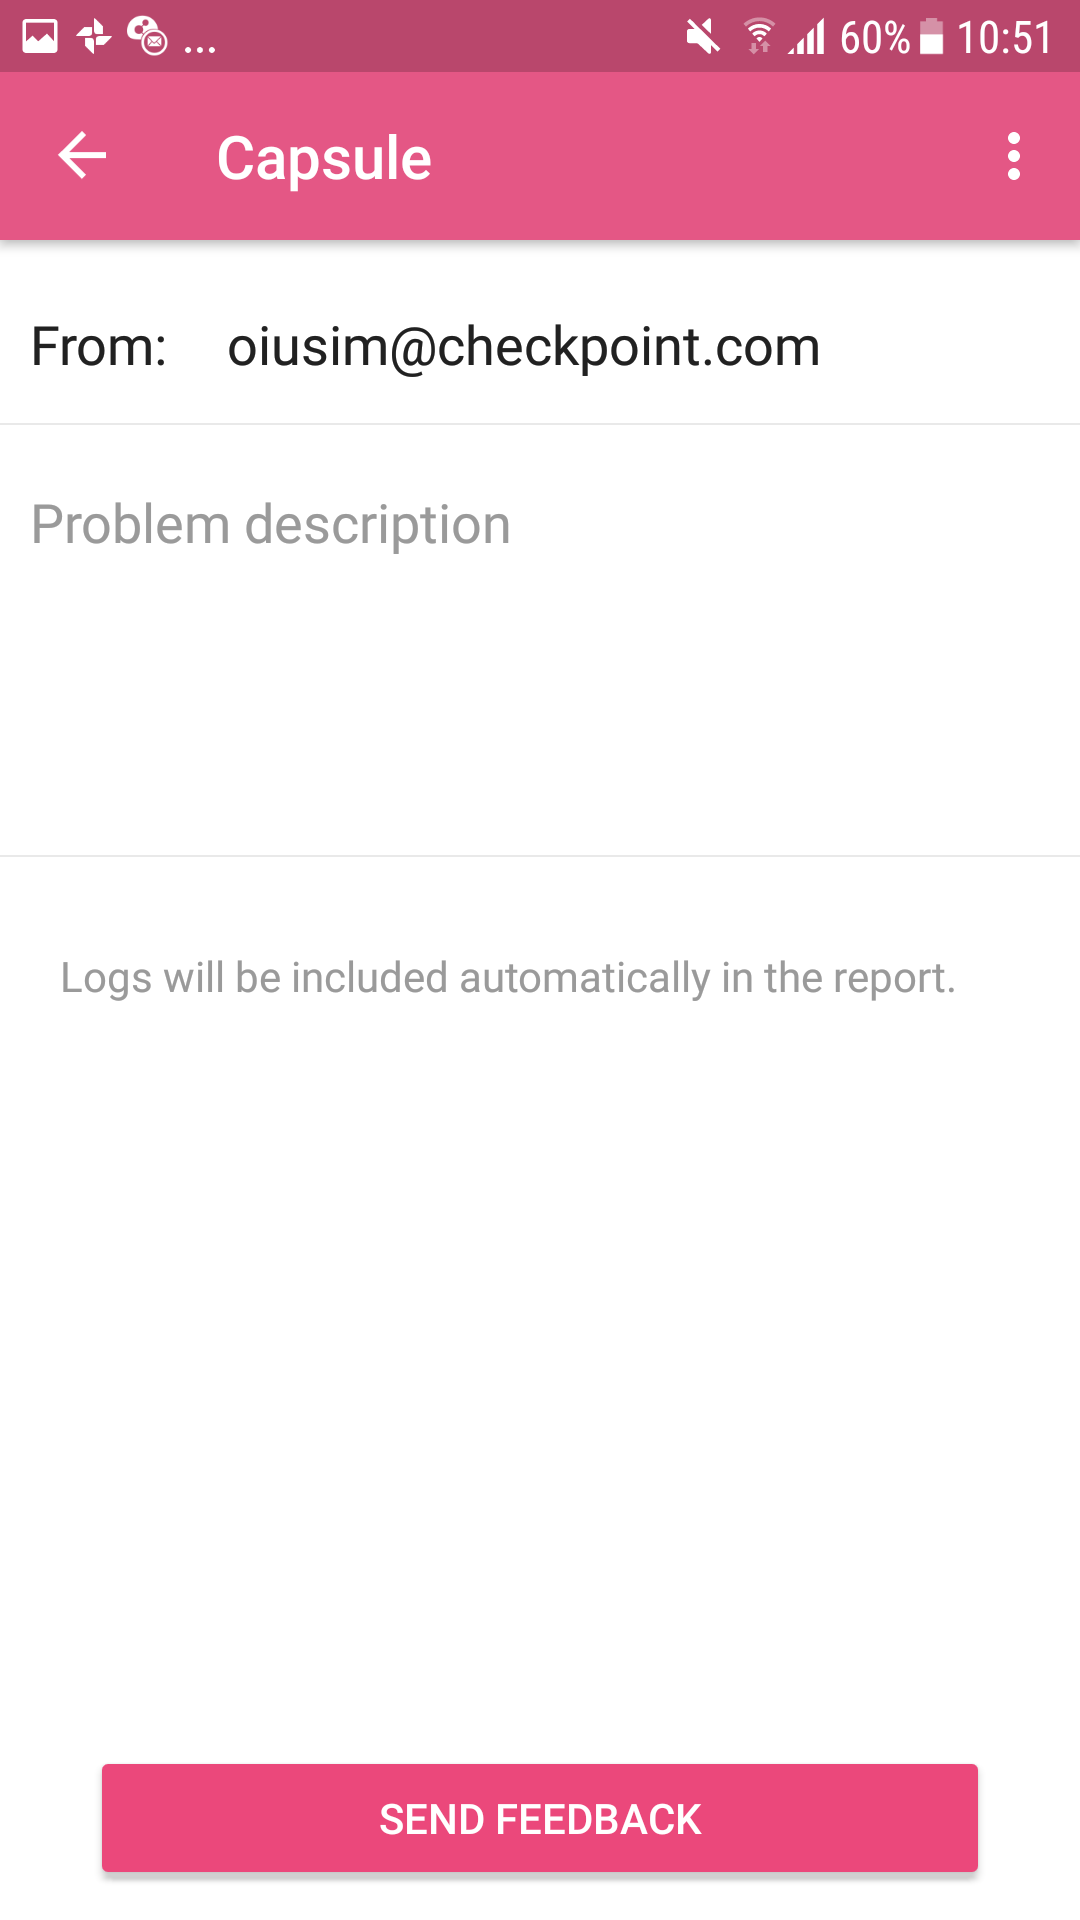
4. Describe the problem shortly in the description field.
5, User can tap "Send Feedback" and then the logs will automatically sent to out report system.
6. User can also tap the 3 dots icon in the top right side and then send the feedback directly by
mail to s developer or support person.
### Sending Advanced Debug Information {#Sending Advanced Debug Information}
Most of the regular debug logs hold mainly information about key operations taking place in app and errors that occur. They do not contain the full raw data of the requests sent to the gateway and Exchange server with the corresponding responses.
The advanced logs are not collected, by default, as they contain private information (email bodies, contact phone numbers, etc.).
Sometimes we need to gather advanced debug information which includes the capture of Capsule traffic, or additional information, which may involve more details about capsule items, or internal database.
This debug information is usually helpful in the following cases:
* User is unable to log in, or any other request from Capsule to the server fails (i.e. can't get policy, or applications list)
* No new mails are fetched upon refreshing, Calendar is not synced, etc'.
* Mail composed is never sent and stuck in the outbox
#### Setting Advanced Debug Logs in an iOS Device {#Setting Advanced Debug Logs in an iOS Device}
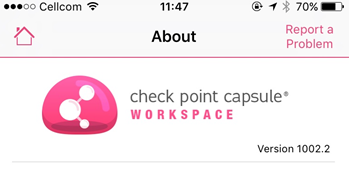
1. In the About screen of Capsule Workspace double tap on the "Check Point Capsule Workspace" banner at the top part of the screen.
2. This will open a "hidden" Advanced Settings screen
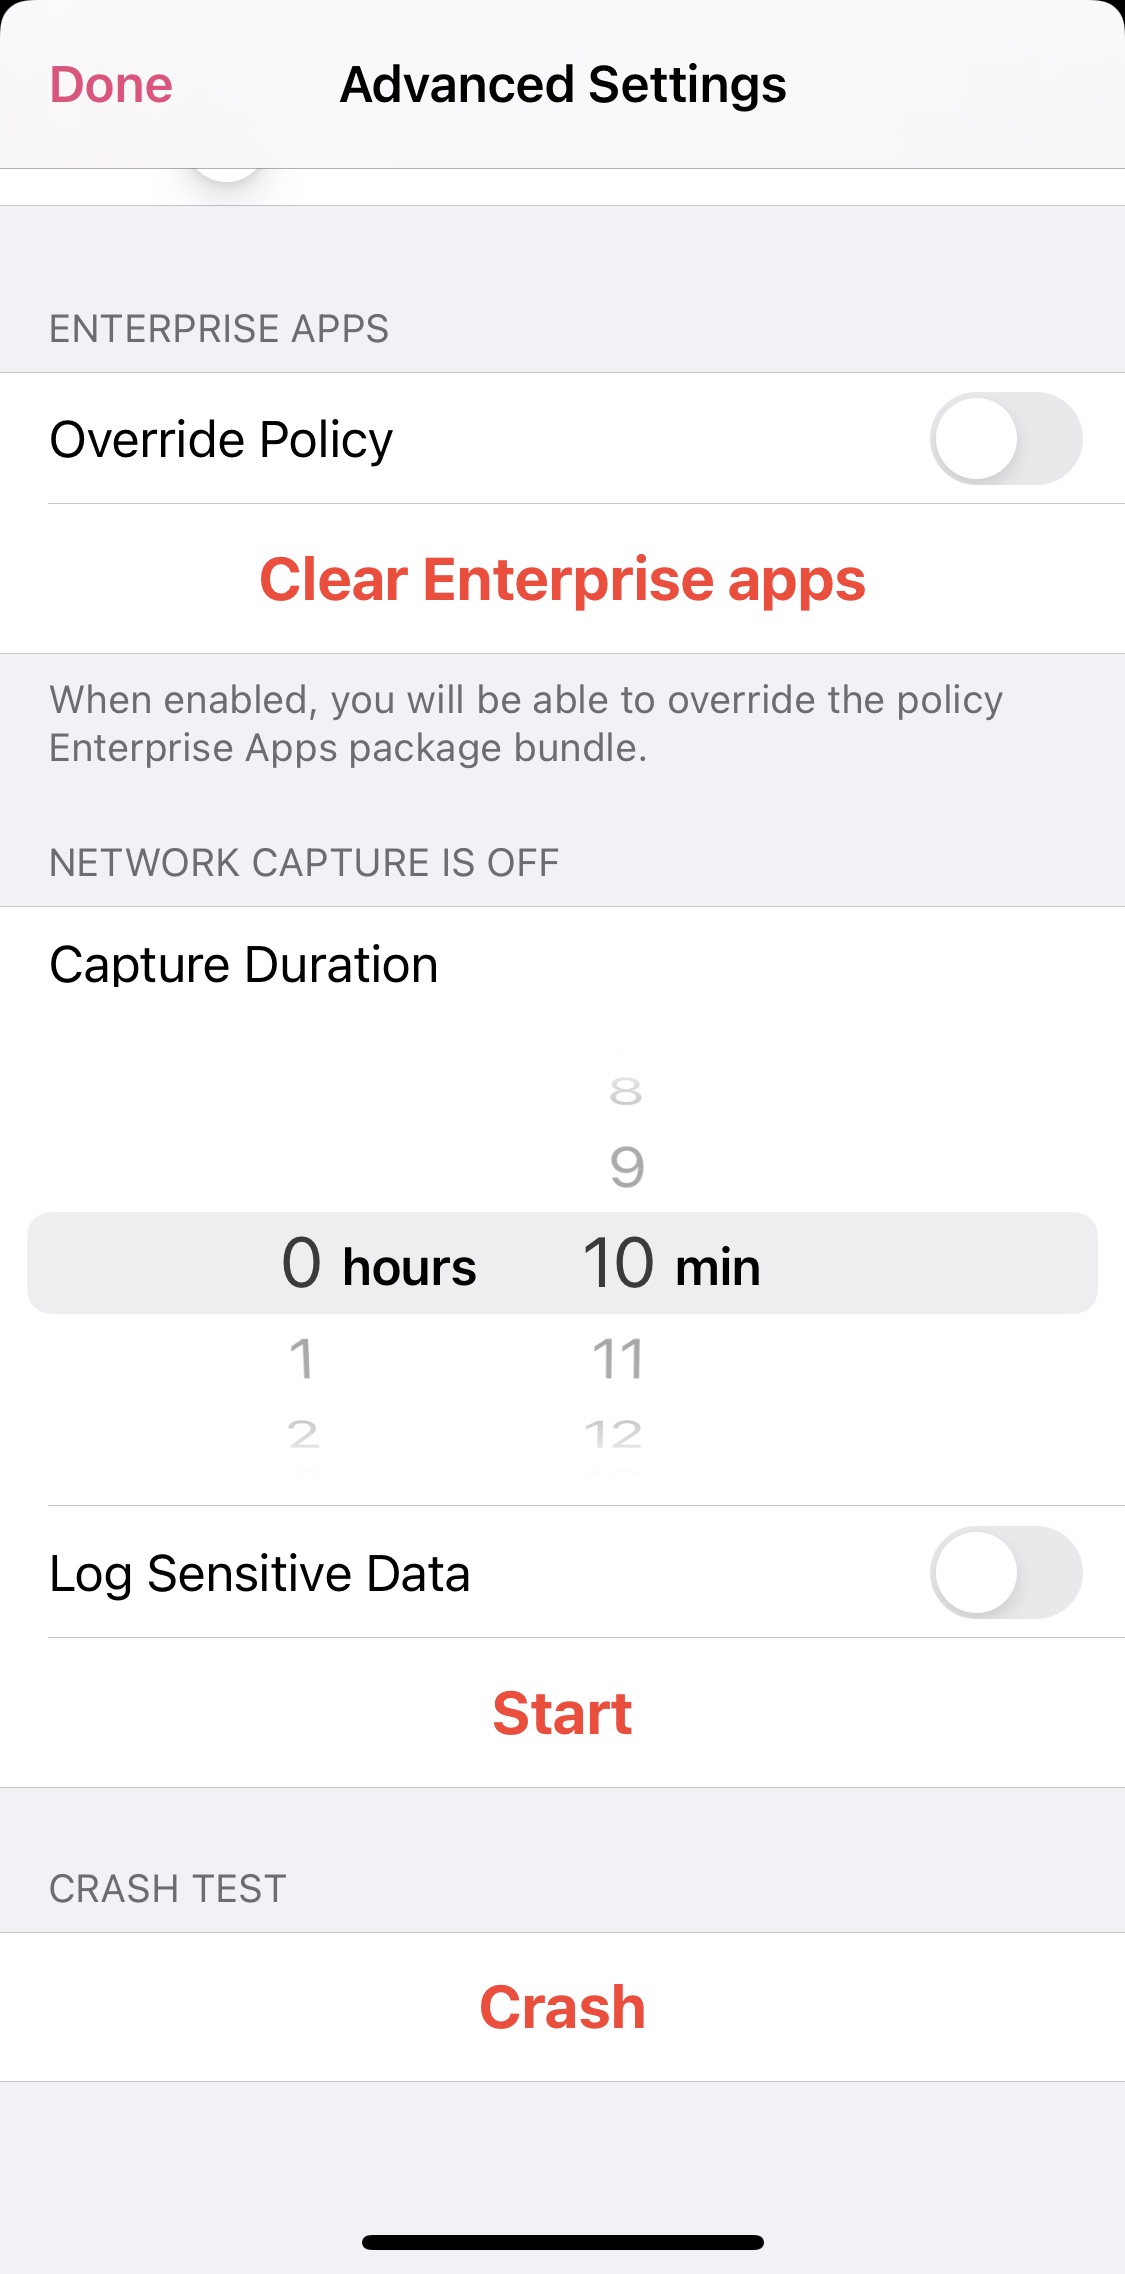
In this screen:
* Enable "Log Sensitive Data"
* Change the capture duration to the needed time
* Press the "Start" button at the bottom.
* Reproduce the problem
* For the defined duration all network traces will be added to the rest of the debug logs.
* After reproducing the problem. Send the debug logs as described in the "*Sending Debug Logs from an iOS device*" section.
#### Setting Advanced Debug Logs in an Android Device {#Setting Advanced Debug Logs in an Android Device}
1. Open the left side drawer and tap "Settings"
2. In the "Settings" screen select 'General"
3. In the "General" screen select "Log Settings". The following screen will be opened:
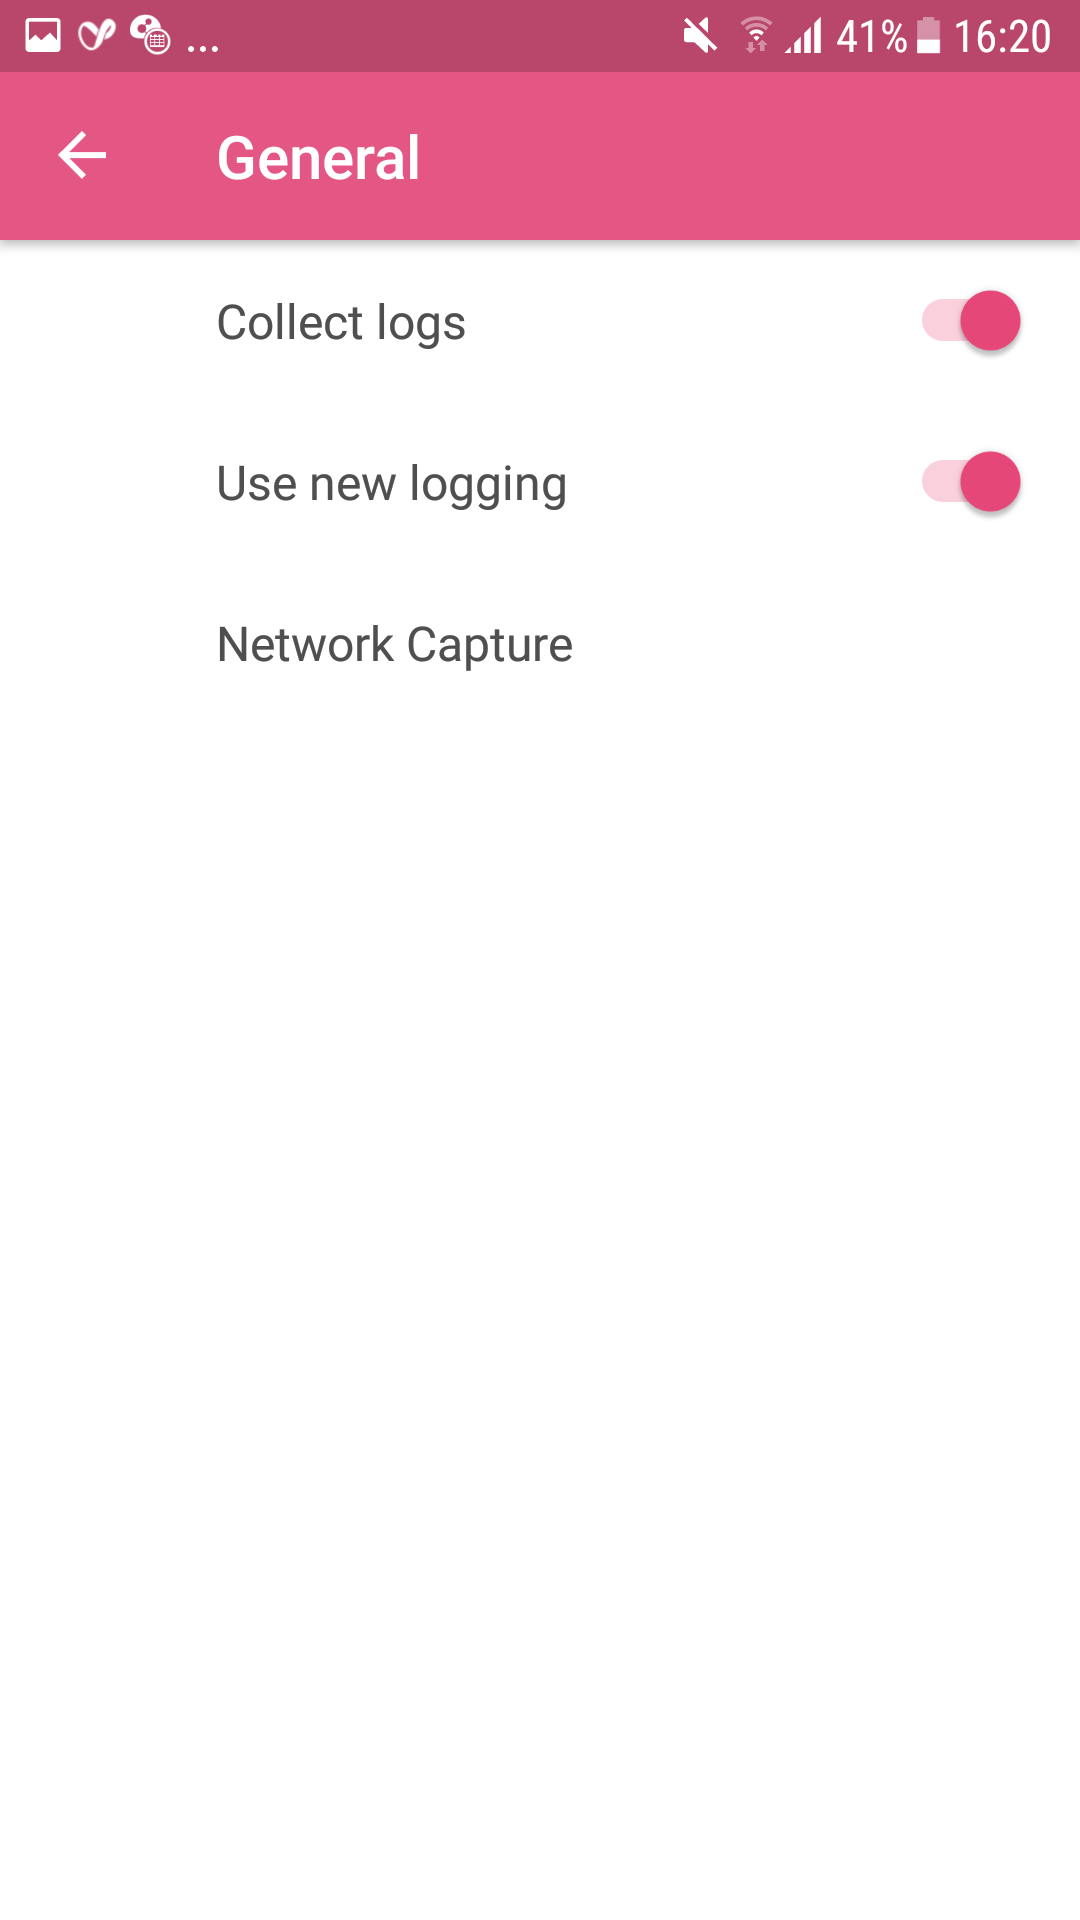
4. Make sure that "collect logs" and "Use new logging" are on.
5. Select "Network Capture"

* Make sure that "Log Sensitive Data" is turned on
* Change the capture duration to the needed time
* Press the "Start" button at the bottom.
* Reproduce the problem
* For the defined duration all network traces will be added to the rest of the debug logs.
After reproducing the problem. Send the debug logs as described in the "Sending Debug Logs from an Android device" section.
Understanding the Debug Logs {#Understanding the Debug Logs}
------------------------------------------------------------
The debug logs are compresses into a zip file. They contain several debug files.
The important debug logs in iOS:
* `CPiPhoneSSLVP*.crash` - This is a crash dump that is created when the app crashes. It contains the exception that caused the app to crash and the stack trace of the app at the moment of the crash.
* `Feedback*.log` - Contains the message the user wrote in the bug report screen
* environment_Logs_\*.log - Contains information about Capsule Workspace environment and policy
* `Logs_*.log` - Contains the full debug logs of the app
* `Traffic_Capture_Logs*.har `- Network trace logs in case that they are available in client
The important debug logs in Android:
* `logs*.log` - Contains the full debug logs of the app
* `*.har` - Network trace logs in case that they are available in client
### Deciphering Capsule Workspace Logs {#Deciphering Capsule Workspace Logs}
Capsule Workspace debug logs contain helpful information which can help us understanding problems it experience.
#### Deciphering iOS Debug Logs {#Deciphering iOS Debug Logs}
1. The start of the debug logs contain general information about the app version, device and OS:
`UDID: B0F84726-91EC-4353-8708-08999574211C`
`OS version: 14.0`
`Model: iPhone12,1`
`Version: 1009.0.22`
`Type: Internal Deployment`
2. For finding a crash in the debug logs look for the following string:
`?INFO? ?Crash? +[UncaughtExceptionHandler writeExceptionInfoToLogFile:] ******************* CRASH ** `
3. Network Errors
Request timed out
*`Error Domain=NSURLErrorDomain Code=-1001 "The request timed out."`*
DNS problem:
`Error Domain=NSURLErrorDomain Code=-1003 "A server with the specified hostname could not be found."`
Additional Network problems:
`Error Domain=NSURLErrorDomain Code=-1009 "The Internet connection appears to be offline."`
`Error Domain=NSURLErrorDomain Code=-1004 "Could not connect to the server."`
4. Exchange request / response errors:
`[SoapReaderUtils readSoapError:] ERROR:: Soap error!`
5. Main screen names:
`BMFolderViewController - Inbox view`
`BMMailViewController - email view`
`_BMInternalMailComposeViewController - mail composer view`
`_BMCalendarDayViewController - calendar day view`
`_BMCalendarMonthViewController - calendar month view`
`BMMeetingViewController - meeting view`
`BMMeetingEditViewController - meeting editor view`
`BMNotesViewController - notes view`
`BMContactViewController - contact view`
`BMContactEditViewController - contact editor view`
`HSApplicationsManager - main app list view`
`RepositoryViewerViewController - saved files view`
#### Deciphering Android Debug Logs {#Deciphering Android Debug Logs}
1. The start of the debug logs contain general information about the app version, device and OS:
`Client version: 7.17.0.57`
`User hash: 3a3089b8`
`DeviceId hash: c2c2d0a2-ae70-4428-90f7-d0d9395540d5`
`User fcm token: fpwBnIEsuk0:APA91bGL-6dzbghQZpUlahN88NwoH8eJyRUeW0ooE5D4FGYyL9i9BUId3FUm_6KmtN1gJdRhGnohvKqyfgVijscQdUAT6z8GuZdezh3JfV6pZYqOslx_GXLhNS_sa7O9qSPwjWHOtOVO`
`Device params - OS Version: 10; Device: samsung samsung SM-G980F ,Build Fingerprint: samsung/x1sxx/x1s:10/QP1A.190711.020/G980FXXU4BTH5:user/release-keys`
2. For finding a crash in the debug logs look for the following string:
`uncaughtException: FATAL`
then in the line below you will find the Exception that caused the crash and one or more stack traces
3. Network Errors
Request times out:
`"Read timed out"`
`"Got ERROR_CONNECTION_TIMED_OUT"`
Other Network issues according to the following errors:
`ERROR_NO_NETWORK`
`ERROR_UNKNOWN_HOST`
`ERROR_NO_ROUTE`
`ERROR_CONNECT_FAILED`
`ERROR_ILLEGAL_ADDRESS`
`ERROR_NETWORK_DOWN`
`ERROR_HOST_DOWN`
`ERROR_NETWORK_UNREACHABLE`
`ERROR_HOST_UNREACHABLE`
`ERROR_CONNECTION_RESET`
`ERROR_CONNECTION_REFUSED`
`ERROR_READ_TIMED_OUT`
4. Exchange request / response errors:
`"ServiceResponseException"`
`" ServiceRequestException"`
5. Main screen names:
`MessageList - mail main screen`
`AllInOneActivity - calendar main screen`
`ListContactsActivity - contacts main screen`
`TasksAppActivity - tasks mainscreen`
`NoteListActivity - notes main screen`
`SecureMessagingActivity - messages main screen`
`FileBrowser - saved files screen`
`CPWebClient - web app (internal browser) screen`
`AppListScreen - app list screen`
Clearing Capsule Persistent Data {#Clearing Capsule Persistent Data}
--------------------------------------------------------------------
Sometimes the client enters to a bad state where the data inside it is corrupted or lost.
In this case user can't read his mails, can't see his meetings or the meetings are get out of sync from the Exchange server.
Capsule has an option in these cases to clear all its data, and get all its information from the beginning.
#### Clear Persistent Data in Capsule iOS {#Clear Persistent Data in Capsule iOS}
* Kill Capsule Workspace application
* Go to Device's Settings -\> Capsule
* Turn On the "Clear Persistent Data" Switch
* Open Capsule Workspace again
#### Clear Persistent Data in Capsule Android {#Clear Persistent Data in Capsule Android}
* Kill Capsule Workspace application
* Logout from Capsule
* Go to the Sites list
* Long tap the site you are working with
* Select delete DB
* Open Capsule Workspace again
Troubleshooting Common Problems {#Troubleshooting Common Problems}
------------------------------------------------------------------
User problems in Capsule are usually caused by one of the following:
* Communication problems between the app -- gateway --exchange server
* Policy \& Gateway misconfigurations
* Exchange problems (either related or unrelated to the app)
* Missing abilities
* Application bugs and crashes
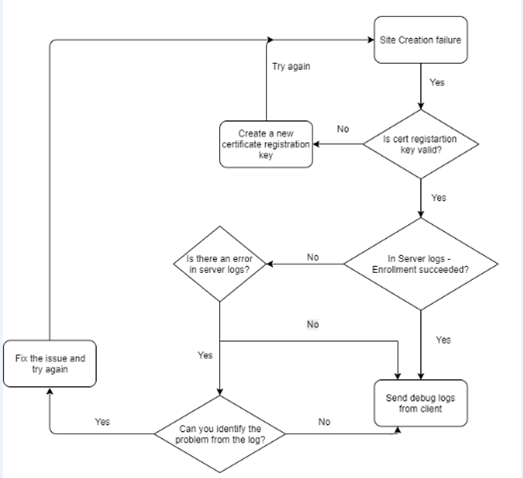
#### Common problems in Create site (first activation) flow {#Common problems in Create site (first activation) flow}
* Wrong activation key - sometimes user enter his password instead of the correct key
* Trying to use an old activation key:
* Sometimes user enters a key that was already used once
* Activation key was expired
Following flow chart can help troubleshooting problems in create site flow:
#### Common problems in Login flow {#Common problems in Login flow}
* Login failed -- wrong user name or password
* Login Failed -- Internal Error -- usually user is not configured in the correct LDAP group in the organization AD.
* User is not configure properly in the GW's policy (No applications are configured for this user)
* User certificate was expired
* User is locked by AD
Following flow chart can help troubleshooting problems in Login flow:

#### Common problems when browsing to internal Web Applications {#Common problems when browsing to internal Web Applications}
* Can't browse to an internal web application -- Error 403 / 401. This is usually a configuration issue. User is not allowed in policy accessing this application
* User doesn't see the mail/calendar/contacts applications. Usually this is a configuration issue. User is not allowed in policy accessing this application
Following flow chart can help troubleshooting problems in Login flow:

Additional Information {#Additional Information}
------------------------------------------------
Debug Push notification issues:
[How to troubleshoot Mobile Access Push Notifications - sk109039](https://supportcenter.checkpoint.com/supportcenter/portal?eventSubmit_doGoviewsolutiondetails=&solutionid=sk109039)
Mobile Access Blade:
* [Admin Guide](https://sc1.checkpoint.com/documents/R80.30/WebAdminGuides/EN/CP_R80.30_MobileAccess_AdminGuide/html_frameset.htm)
* [Troubleshooting Mobile Access Server side](https://supportcenter.checkpoint.com/supportcenter/portal?eventSubmit_doGoviewsolutiondetails=&solutionid=sk104577)
---
# Agent Instructions
This content is from the Check Point Support Center (https://support.checkpoint.com), the official knowledge base for Check Point cybersecurity products.
## Navigating This Knowledge Base
- **Complete index**: [llms.txt](https://support.checkpoint.com/llms.txt)
- **All SK articles**: [SecureKnowledge Sitemap](https://support.checkpoint.com/sitemaps/secureknowledge-sitemap-index.xml)
- **SK article URL pattern**: `https://support.checkpoint.com/results/sk/{skId}`
- **Markdown responses**: AI bot User-Agents automatically receive `text/markdown` content